.svg)
.svg)
PRODUCTS

We ran a custom Python test suite against 1,660 extracted frames, measuring VMAF, SSIM, PSNR, edge sharpness, compression artifacts, temporal flicker, noise grain, motion stability, and A/V sync in a single pipeline. FastPix scored 94.97 VMAF (above Netflix's broadcast threshold), 0.991 SSIM, and 47.2 dB PSNR average with a floor of 46.03 dB across every frame. Full score cards, heatmap analysis, VMAF component breakdown, and adaptive bitrate ladder results inside.
OTT platforms live and die by viewer experience. A single point drop in VMAF during a live sports final, a 200 ms A/V sync drift in a product demo, or visible blockiness in a cinematic scene. Each one costs you subscribers. We put FastPix's encoding pipeline through a rigorous, frame-level quality gauntlet: 1,660 frames, 9 independent test categories, 8 custom Python scripts, and 1,660 per-frame SSIM heatmaps. The verdict: broadcast-grade quality at streaming-grade compression, above Netflix's own internal threshold on every perceptual metric.

Performance benchmarks tell you how fast a video platform processes and delivers content. Quality benchmarks tell you what actually happens to the content itself. These are different questions, and the second is often ignored until viewers start complaining about blocky playback, washed-out colors, or audio that drifts from the picture.
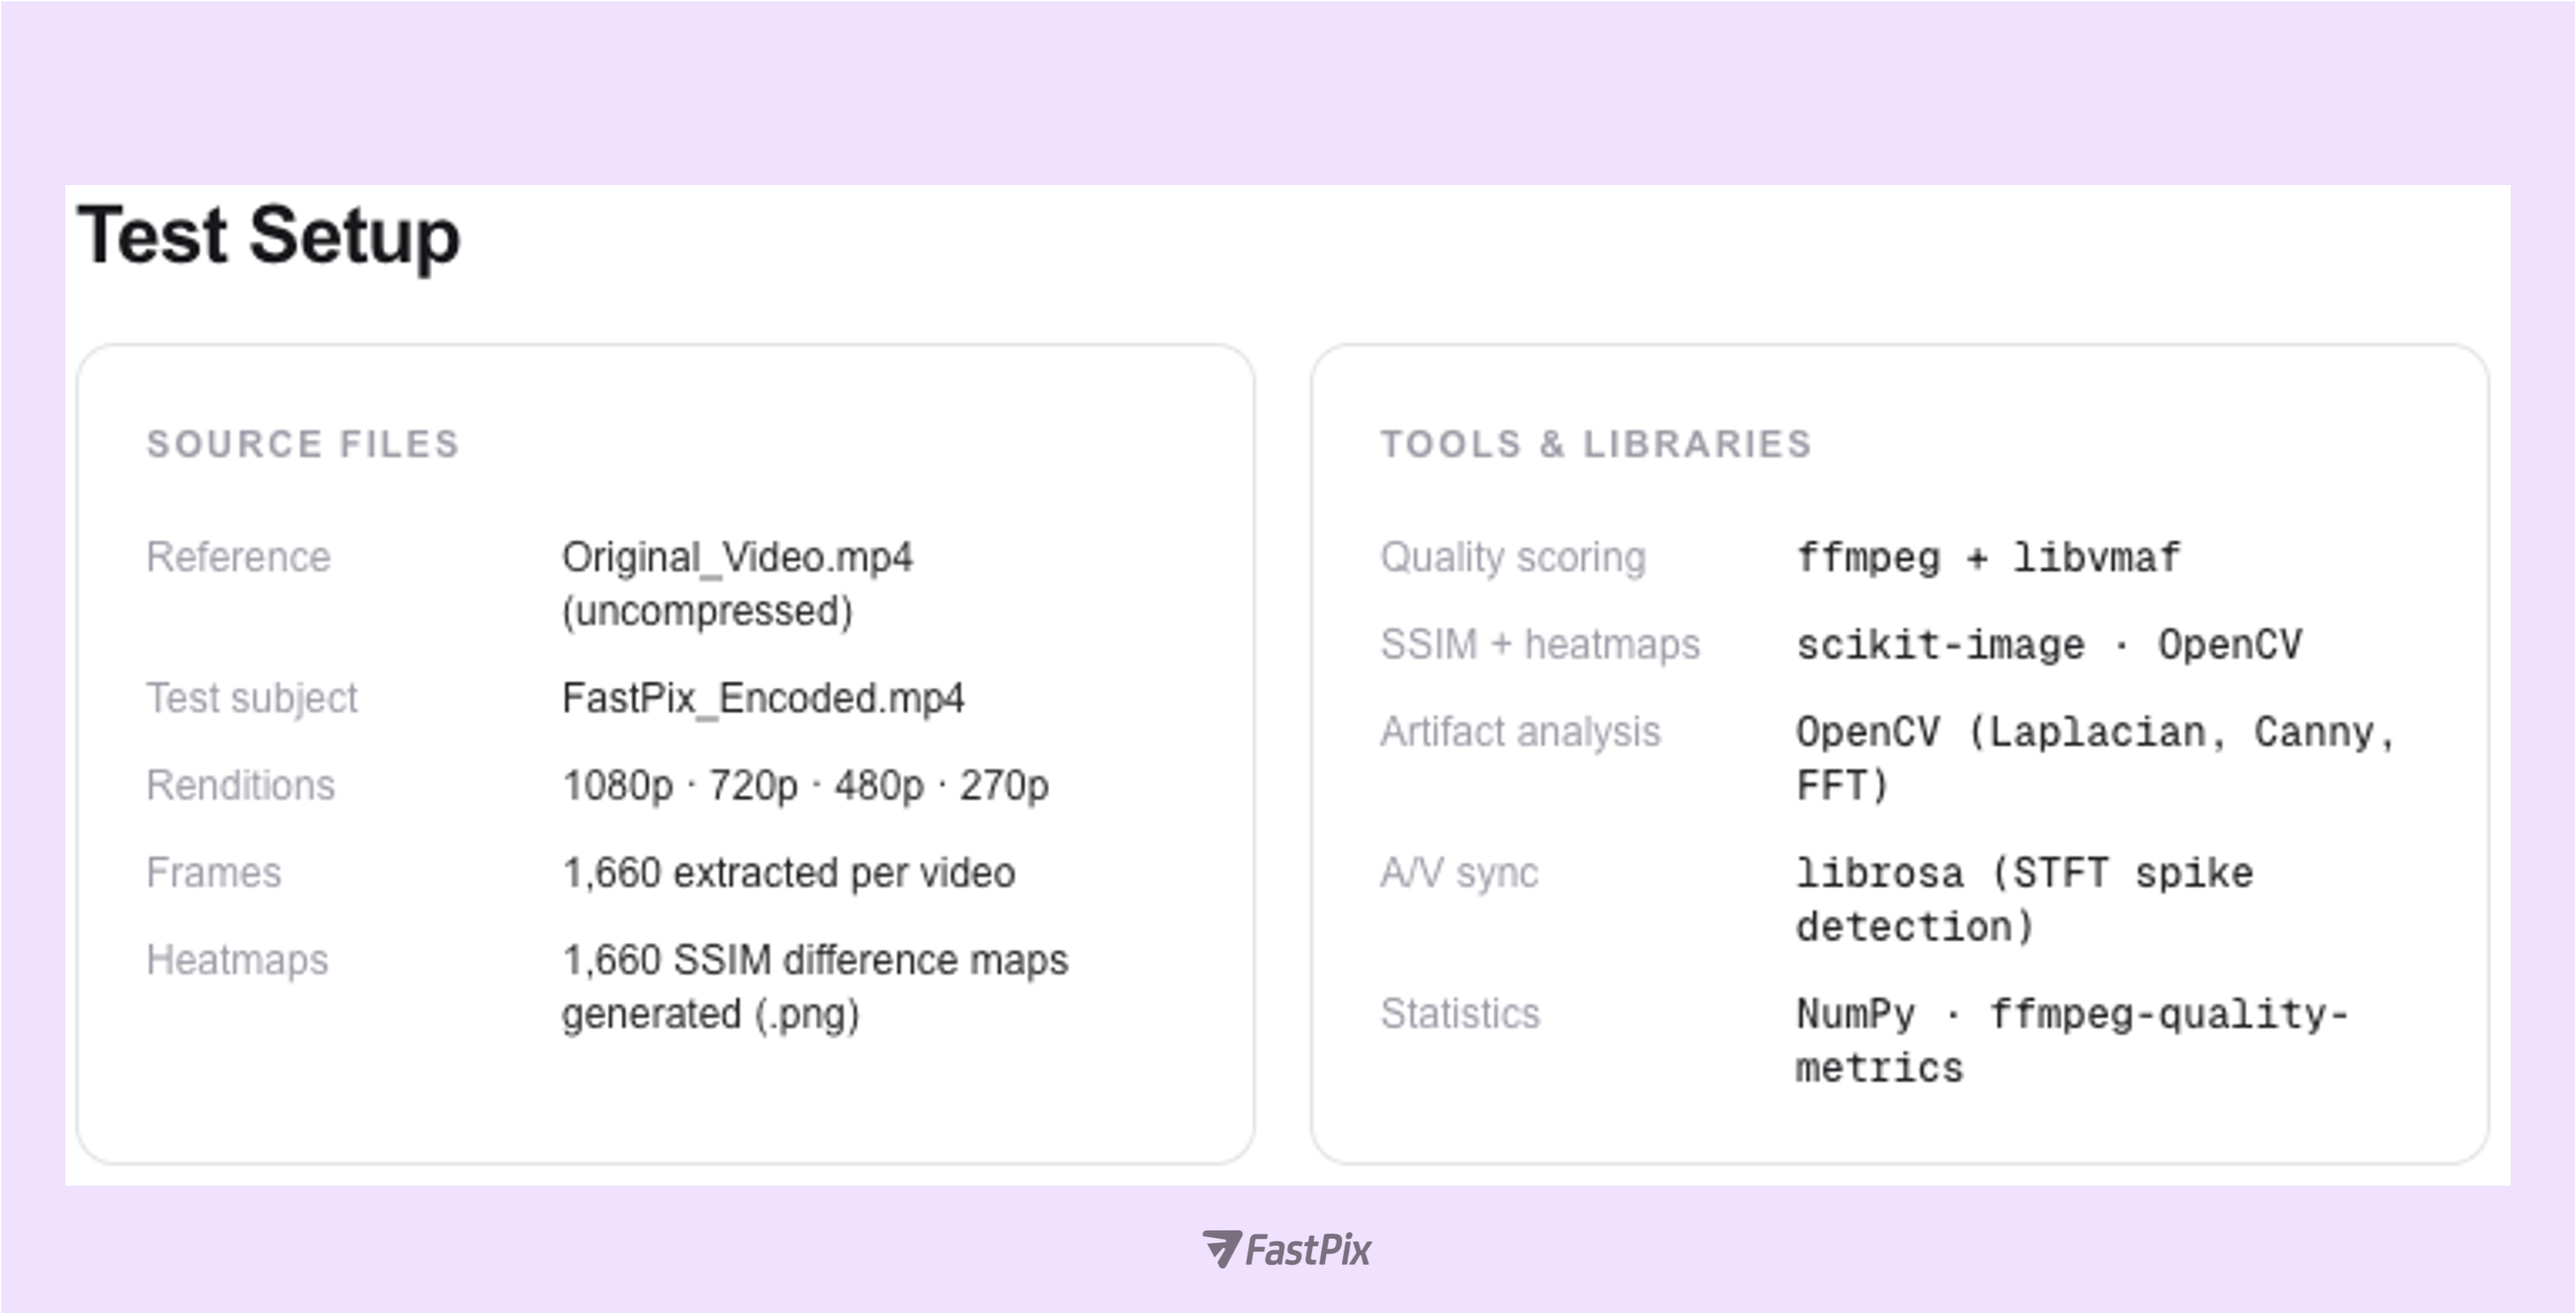
FastPix re-encodes every uploaded video into an adaptive HLS ladder: 1080p, 720p, 480p, and 270p. Each transcode pass introduces some degree of perceptual change. The question is never whether compression changes the video (it always does) but whether those changes are perceptible, and whether they degrade the viewer experience. To answer this objectively, we built a custom Python test suite using ffmpeg, libvmaf, OpenCV, scikit-image, and librosa, and measured FastPix across multiple independent quality dimensions.
We analyzed FastPix’s video output across nine critical quality dimensions to measure visual accuracy, compression efficiency, and playback stability.
SSIM (Structural Similarity Index Measure) compares luminance, contrast, and structural patterns between two frames on a 0–1 scale. Unlike pixel-error metrics, SSIM models how humans perceive image degradation, making it far more meaningful than raw error counts for predicting viewer experience. An SSIM ≥ 0.95 is the benchmark for “excellent” structural fidelity in broadcast workflows.
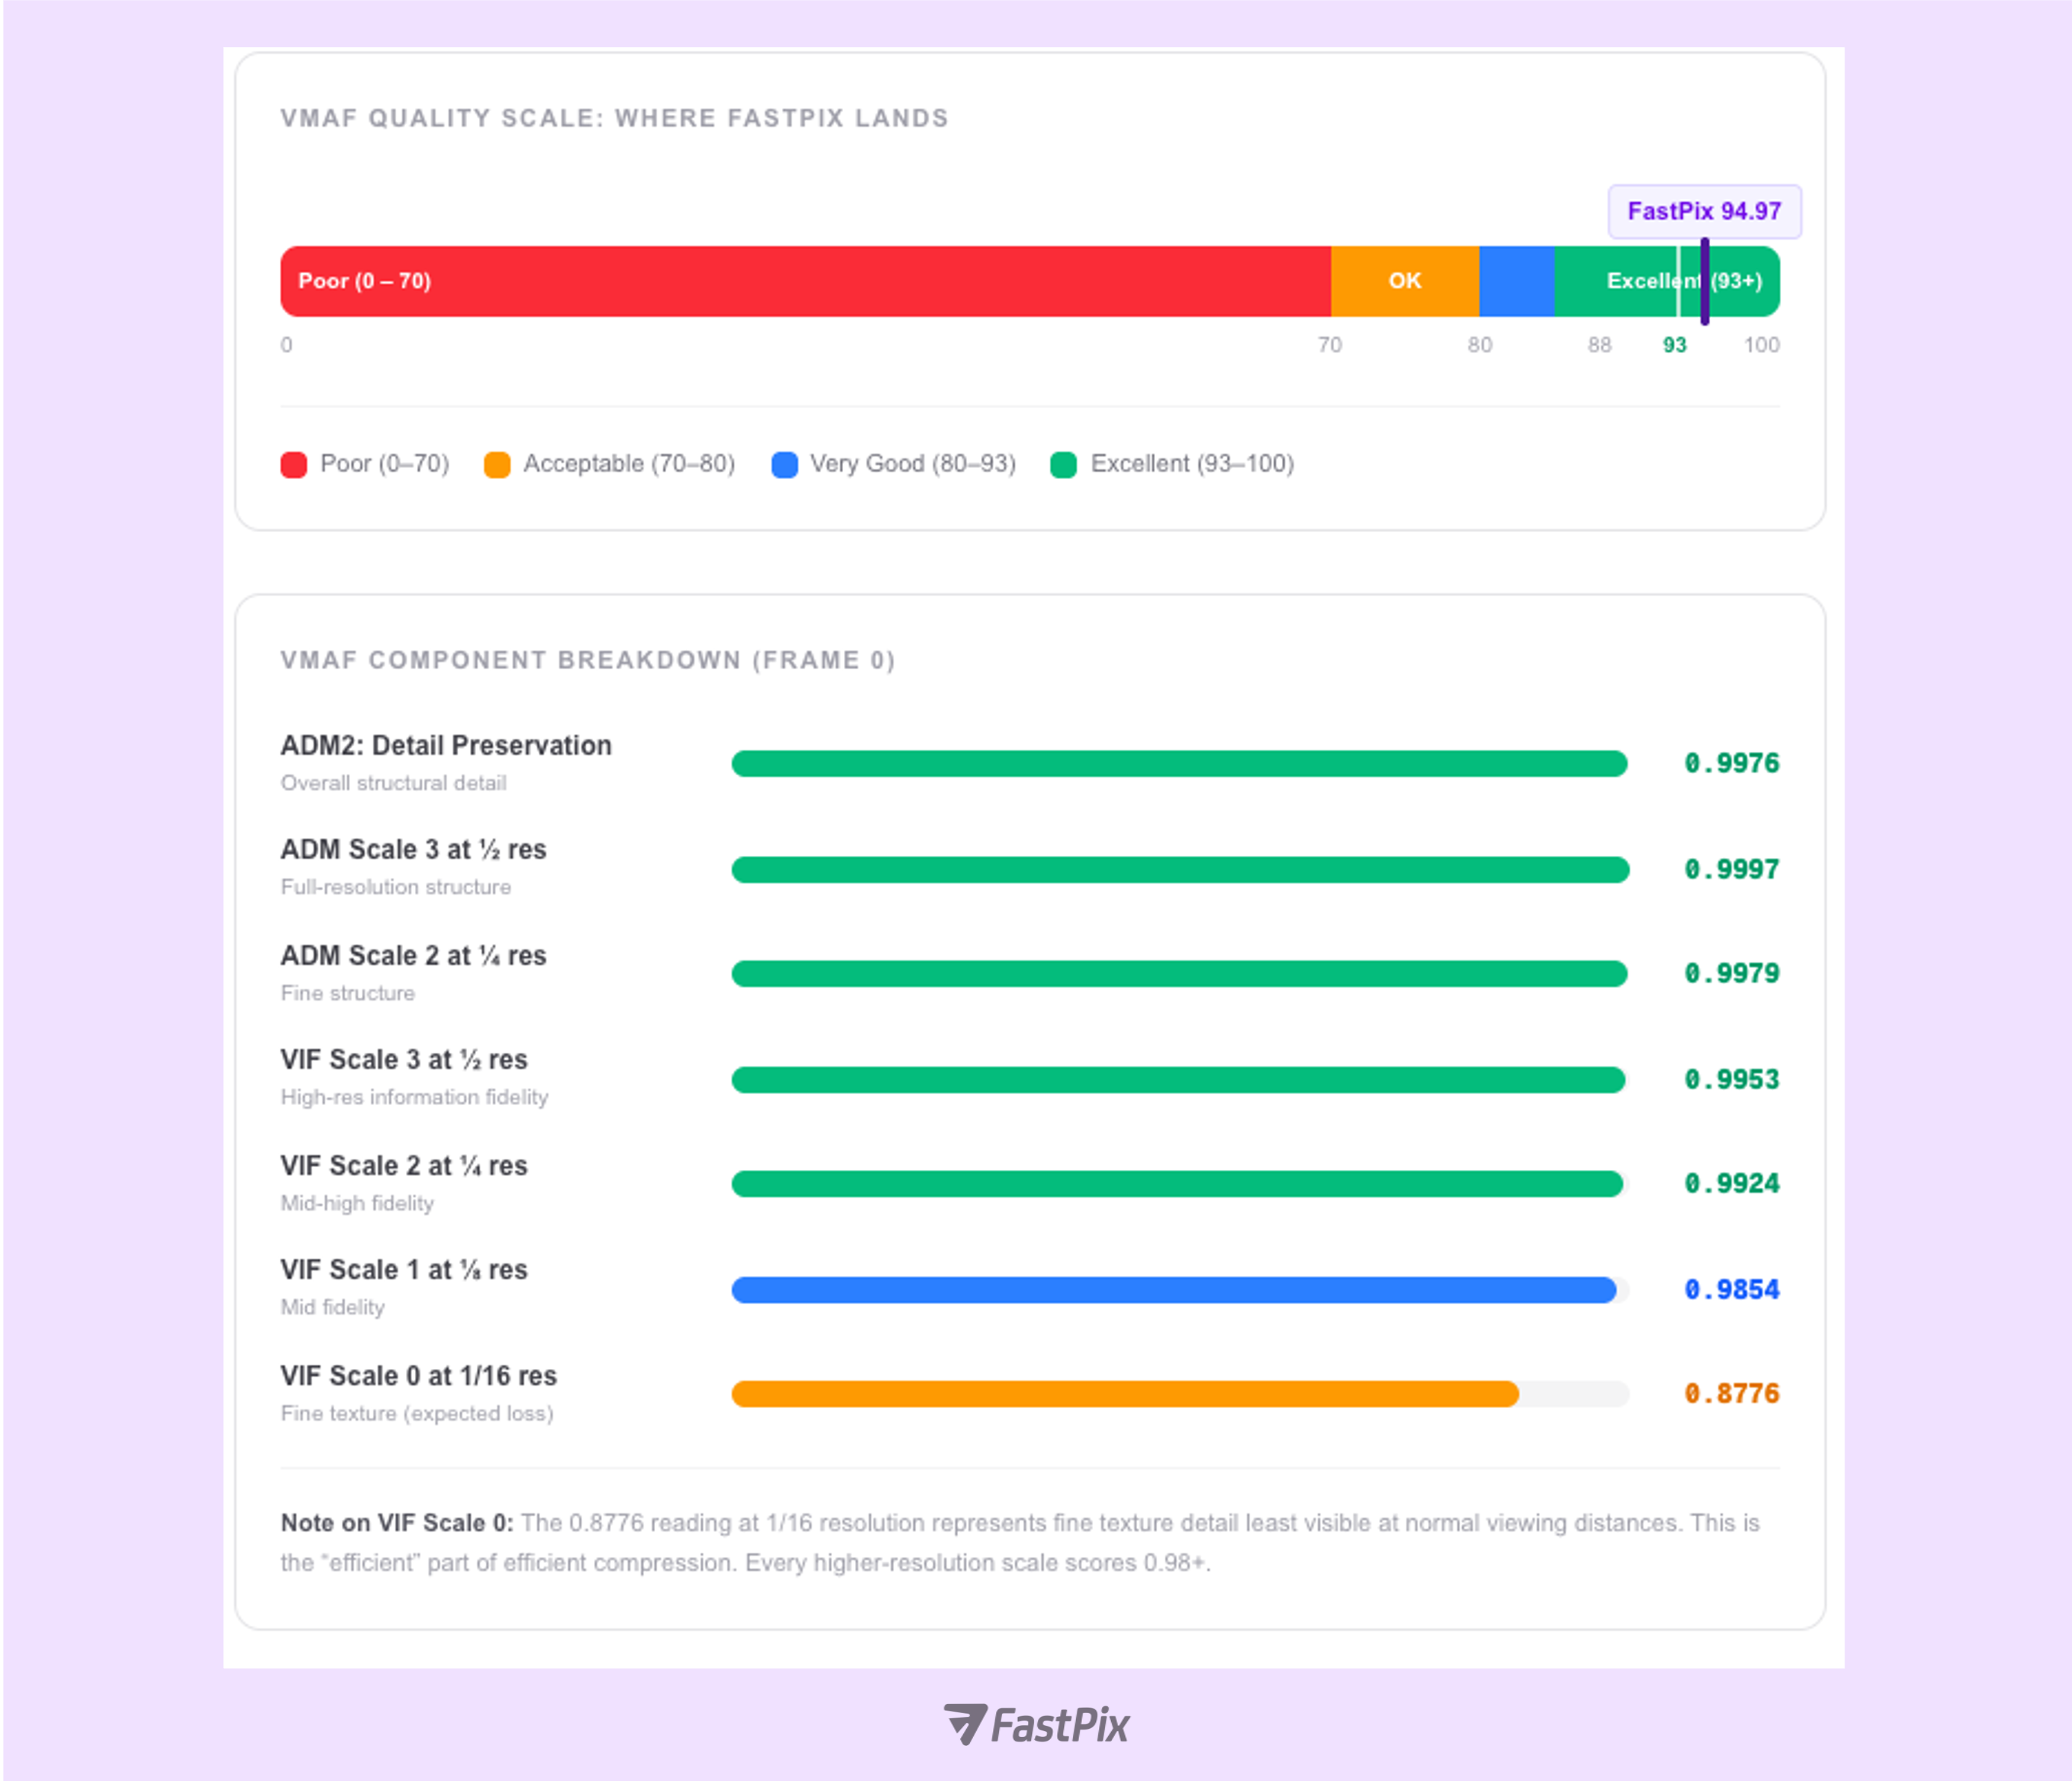
VMAF (Video Multi-Method Assessment Fusion), developed by Netflix, fuses Visual Information Fidelity (VIF) at four spatial scales, Detail Loss Metric (ADM2), and motion statistics into a single 0–100 score trained on real human viewing data. It is the industry-standard quality metric, used by Netflix, YouTube, and virtually every major CDN. A VMAF above 93 is “Excellent,” the threshold at which most viewers cannot distinguish encoded output from the source, even under controlled A/B viewing conditions.
During fast-motion sports such as a penalty kick or a sprinting athlete, encoders under bitrate pressure often let VMAF slip below 88, causing visible macro-blocking. FastPix's VMAF of 94.97 and PSNR floor of 46.03 dB even at high-motion scene cuts means your sports stream stays broadcast-quality when viewer attention is highest, preventing the churn moment every OTT operator fears.
What this means for your platform
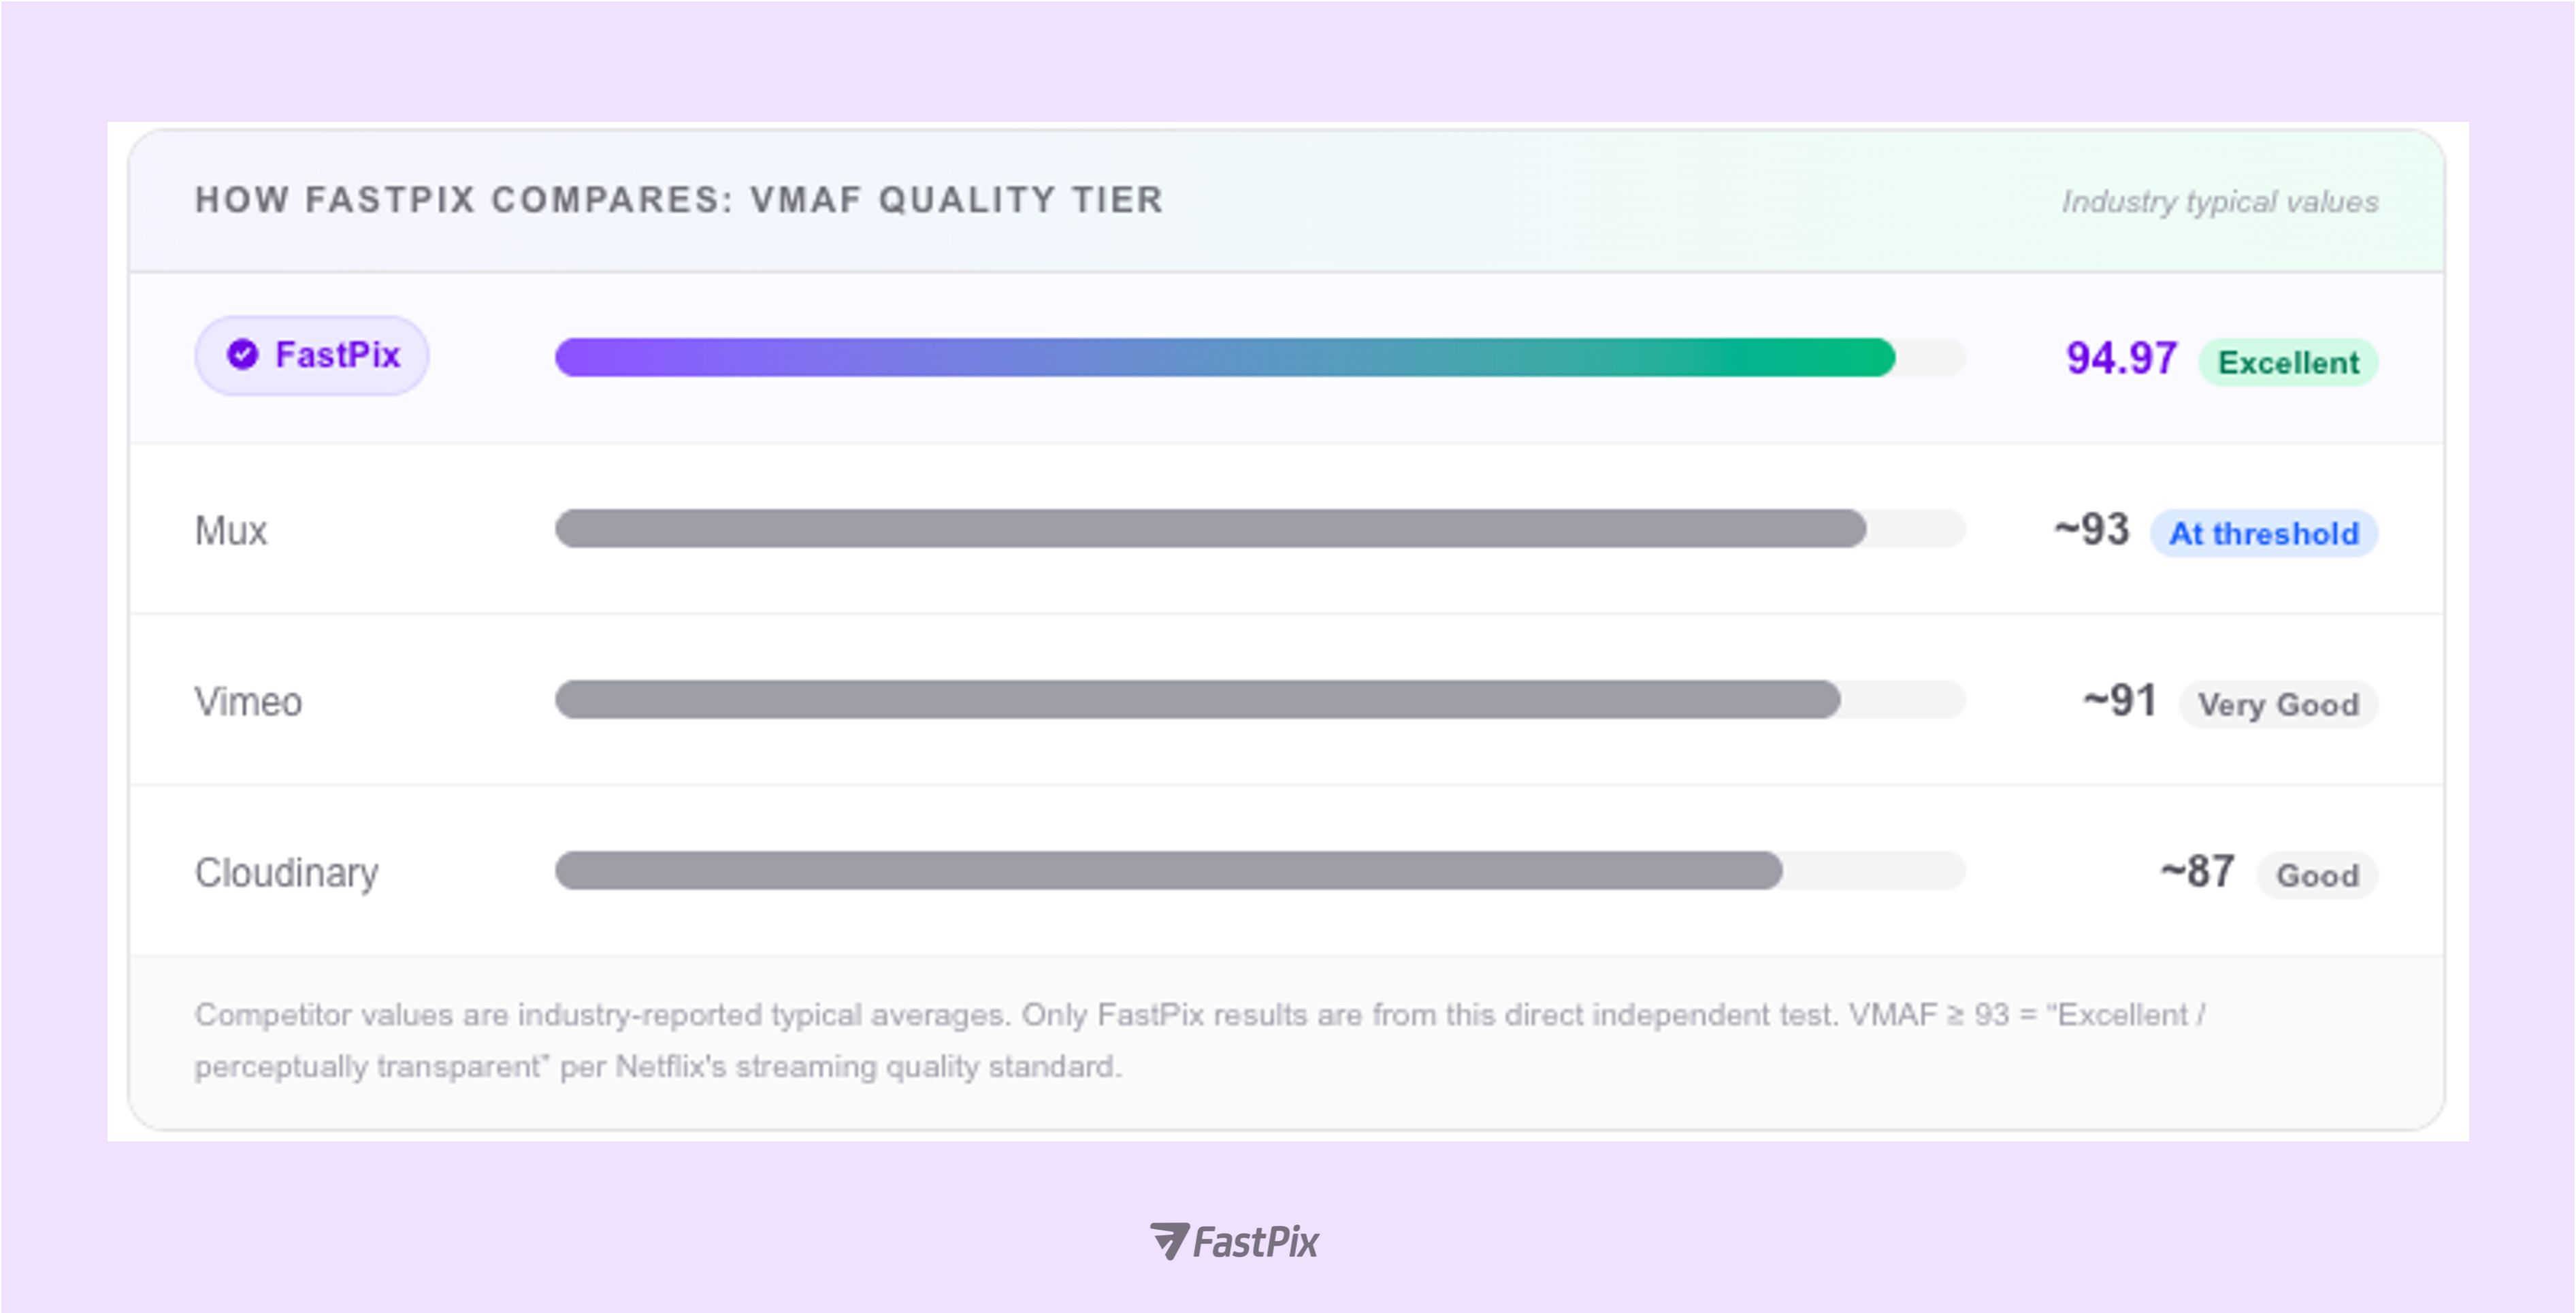
VMAF 94.97 is above Netflix's internal broadcast threshold of 93 and above the typical reported values for Mux (~93), Vimeo (~91), and Cloudinary (~87). In practice, the vast majority of viewers will not be able to distinguish the FastPix-encoded output from the original source. For OTT operators, this means investing in FastPix quality headroom is the same as investing in subscriber retention.
This video is the original FastPix encoded output.
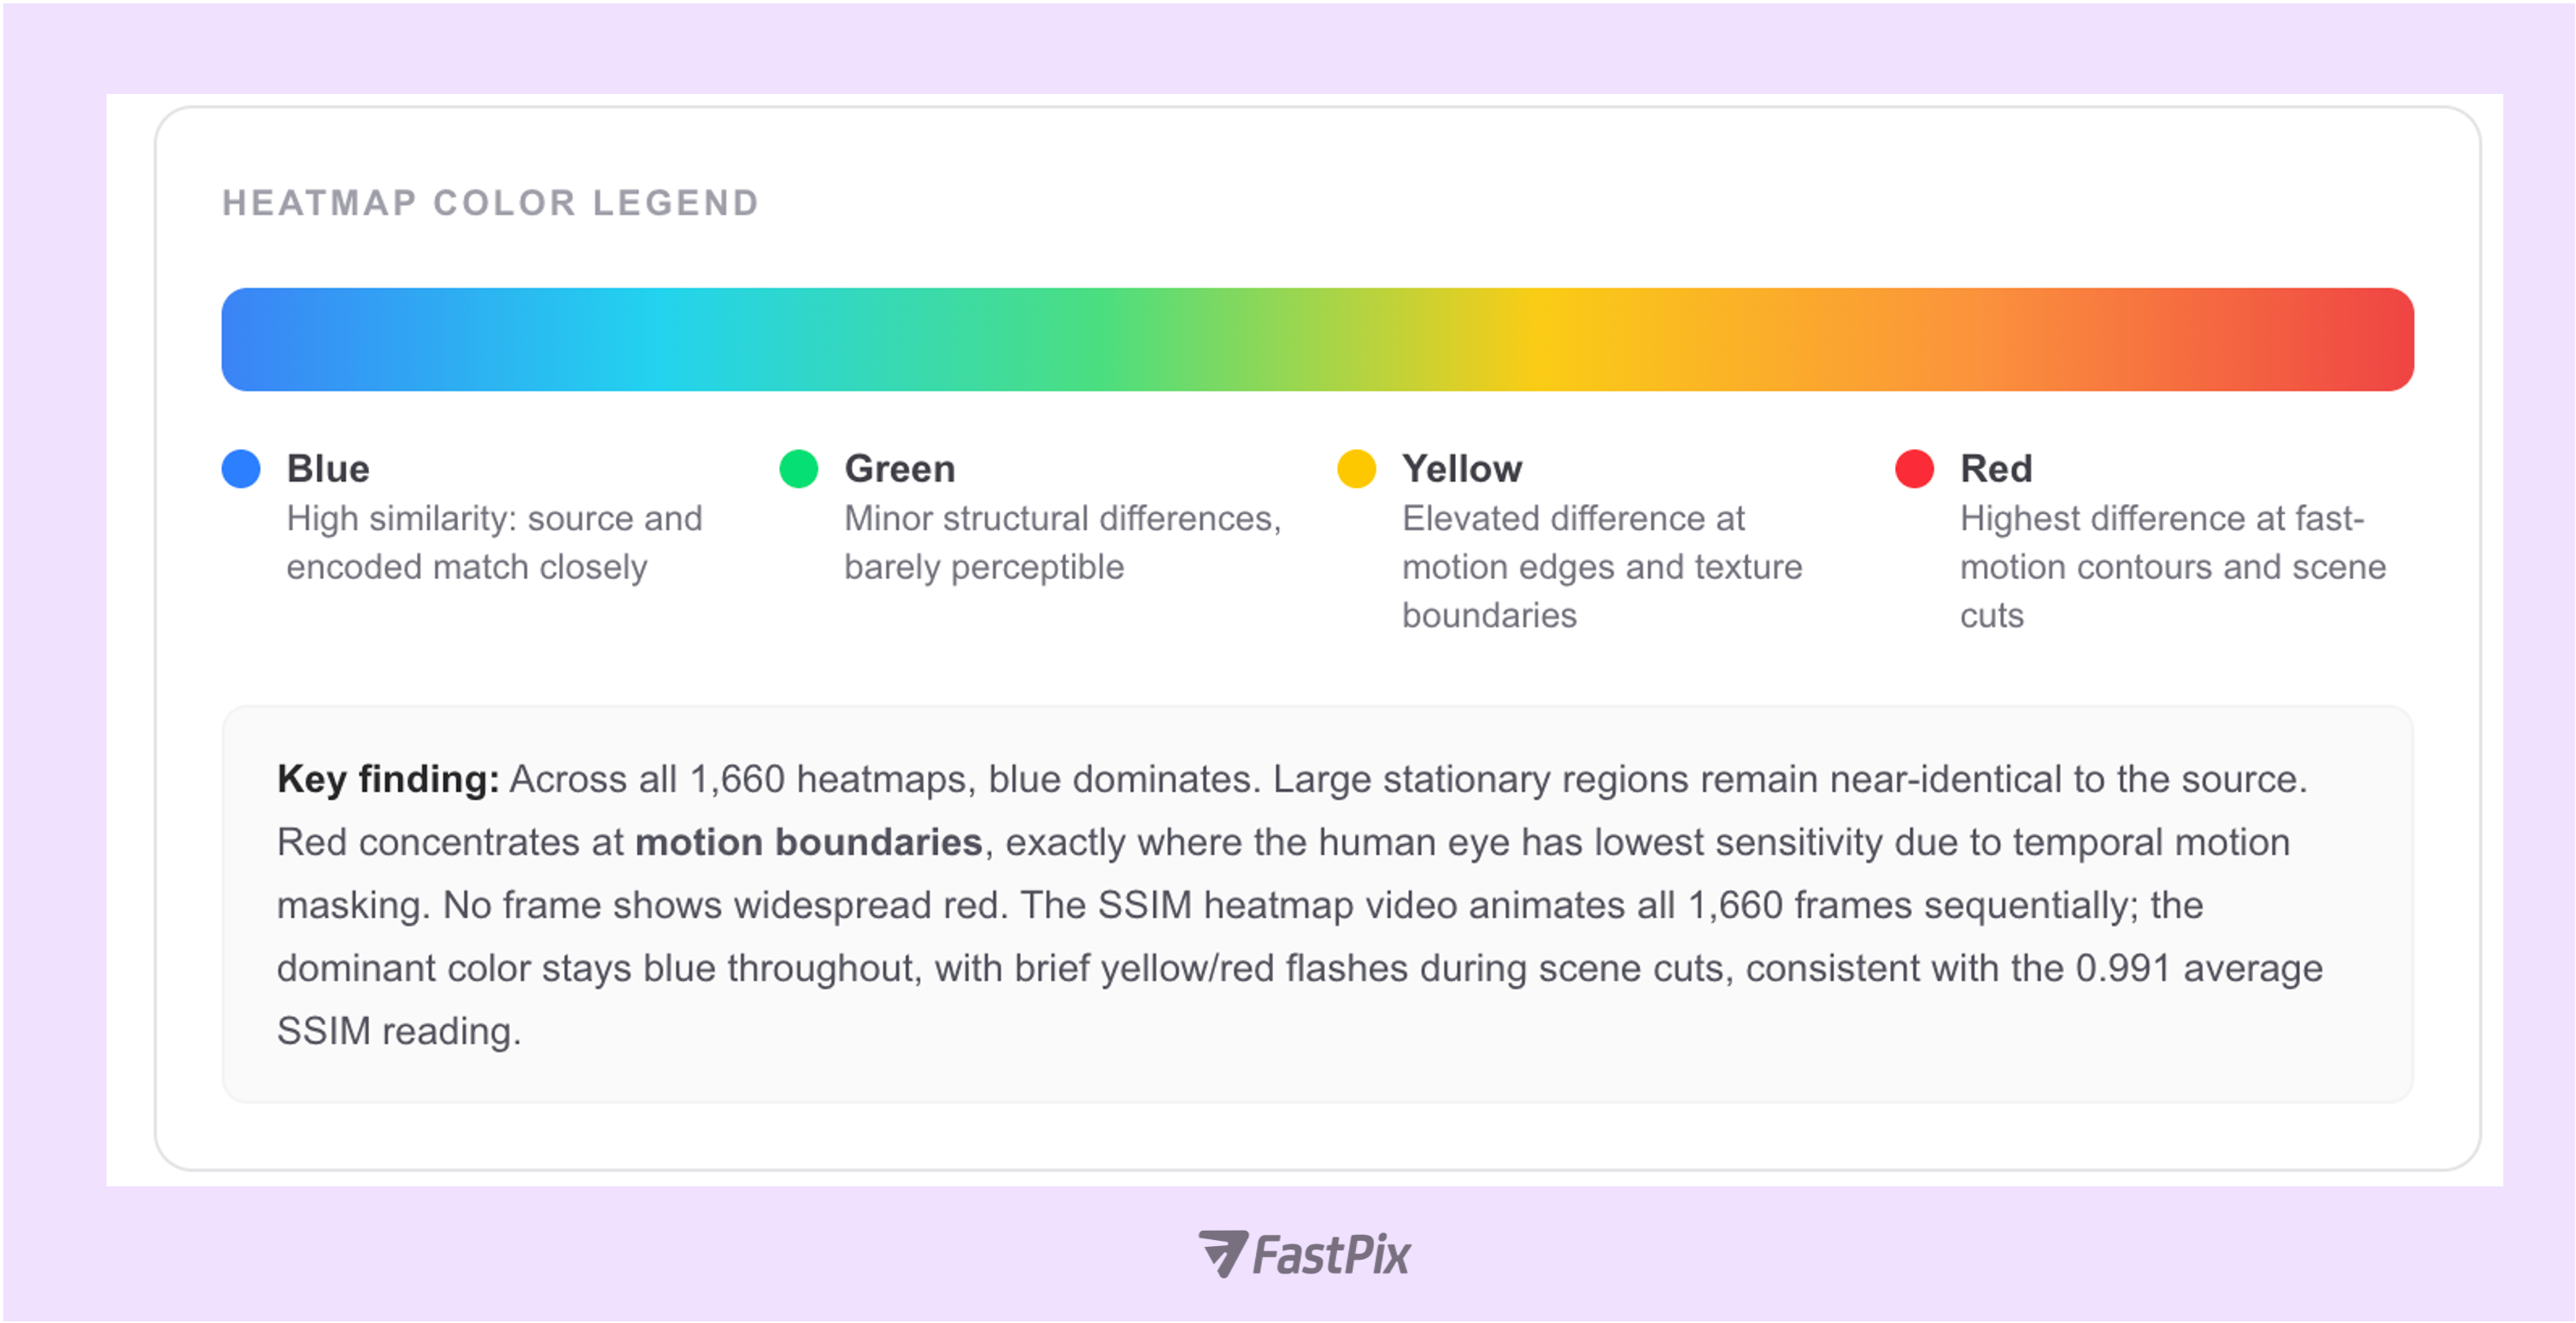
And video here, shows per-frame SSIM difference heatmap generated across all frames. Blue = high similarity, red = highest structural difference at motion boundaries.
Peak Signal-to-Noise Ratio (PSNR) quantifies encoding noise in decibels (dB). It is computed independently for Y (luma), U (blue-difference chroma), and V (red-difference chroma) channels. While PSNR is a mathematical metric, not a perceptual one, but it provides a reliable lower bound: consistent readings above 45 dB indicate broadcast-grade fidelity.
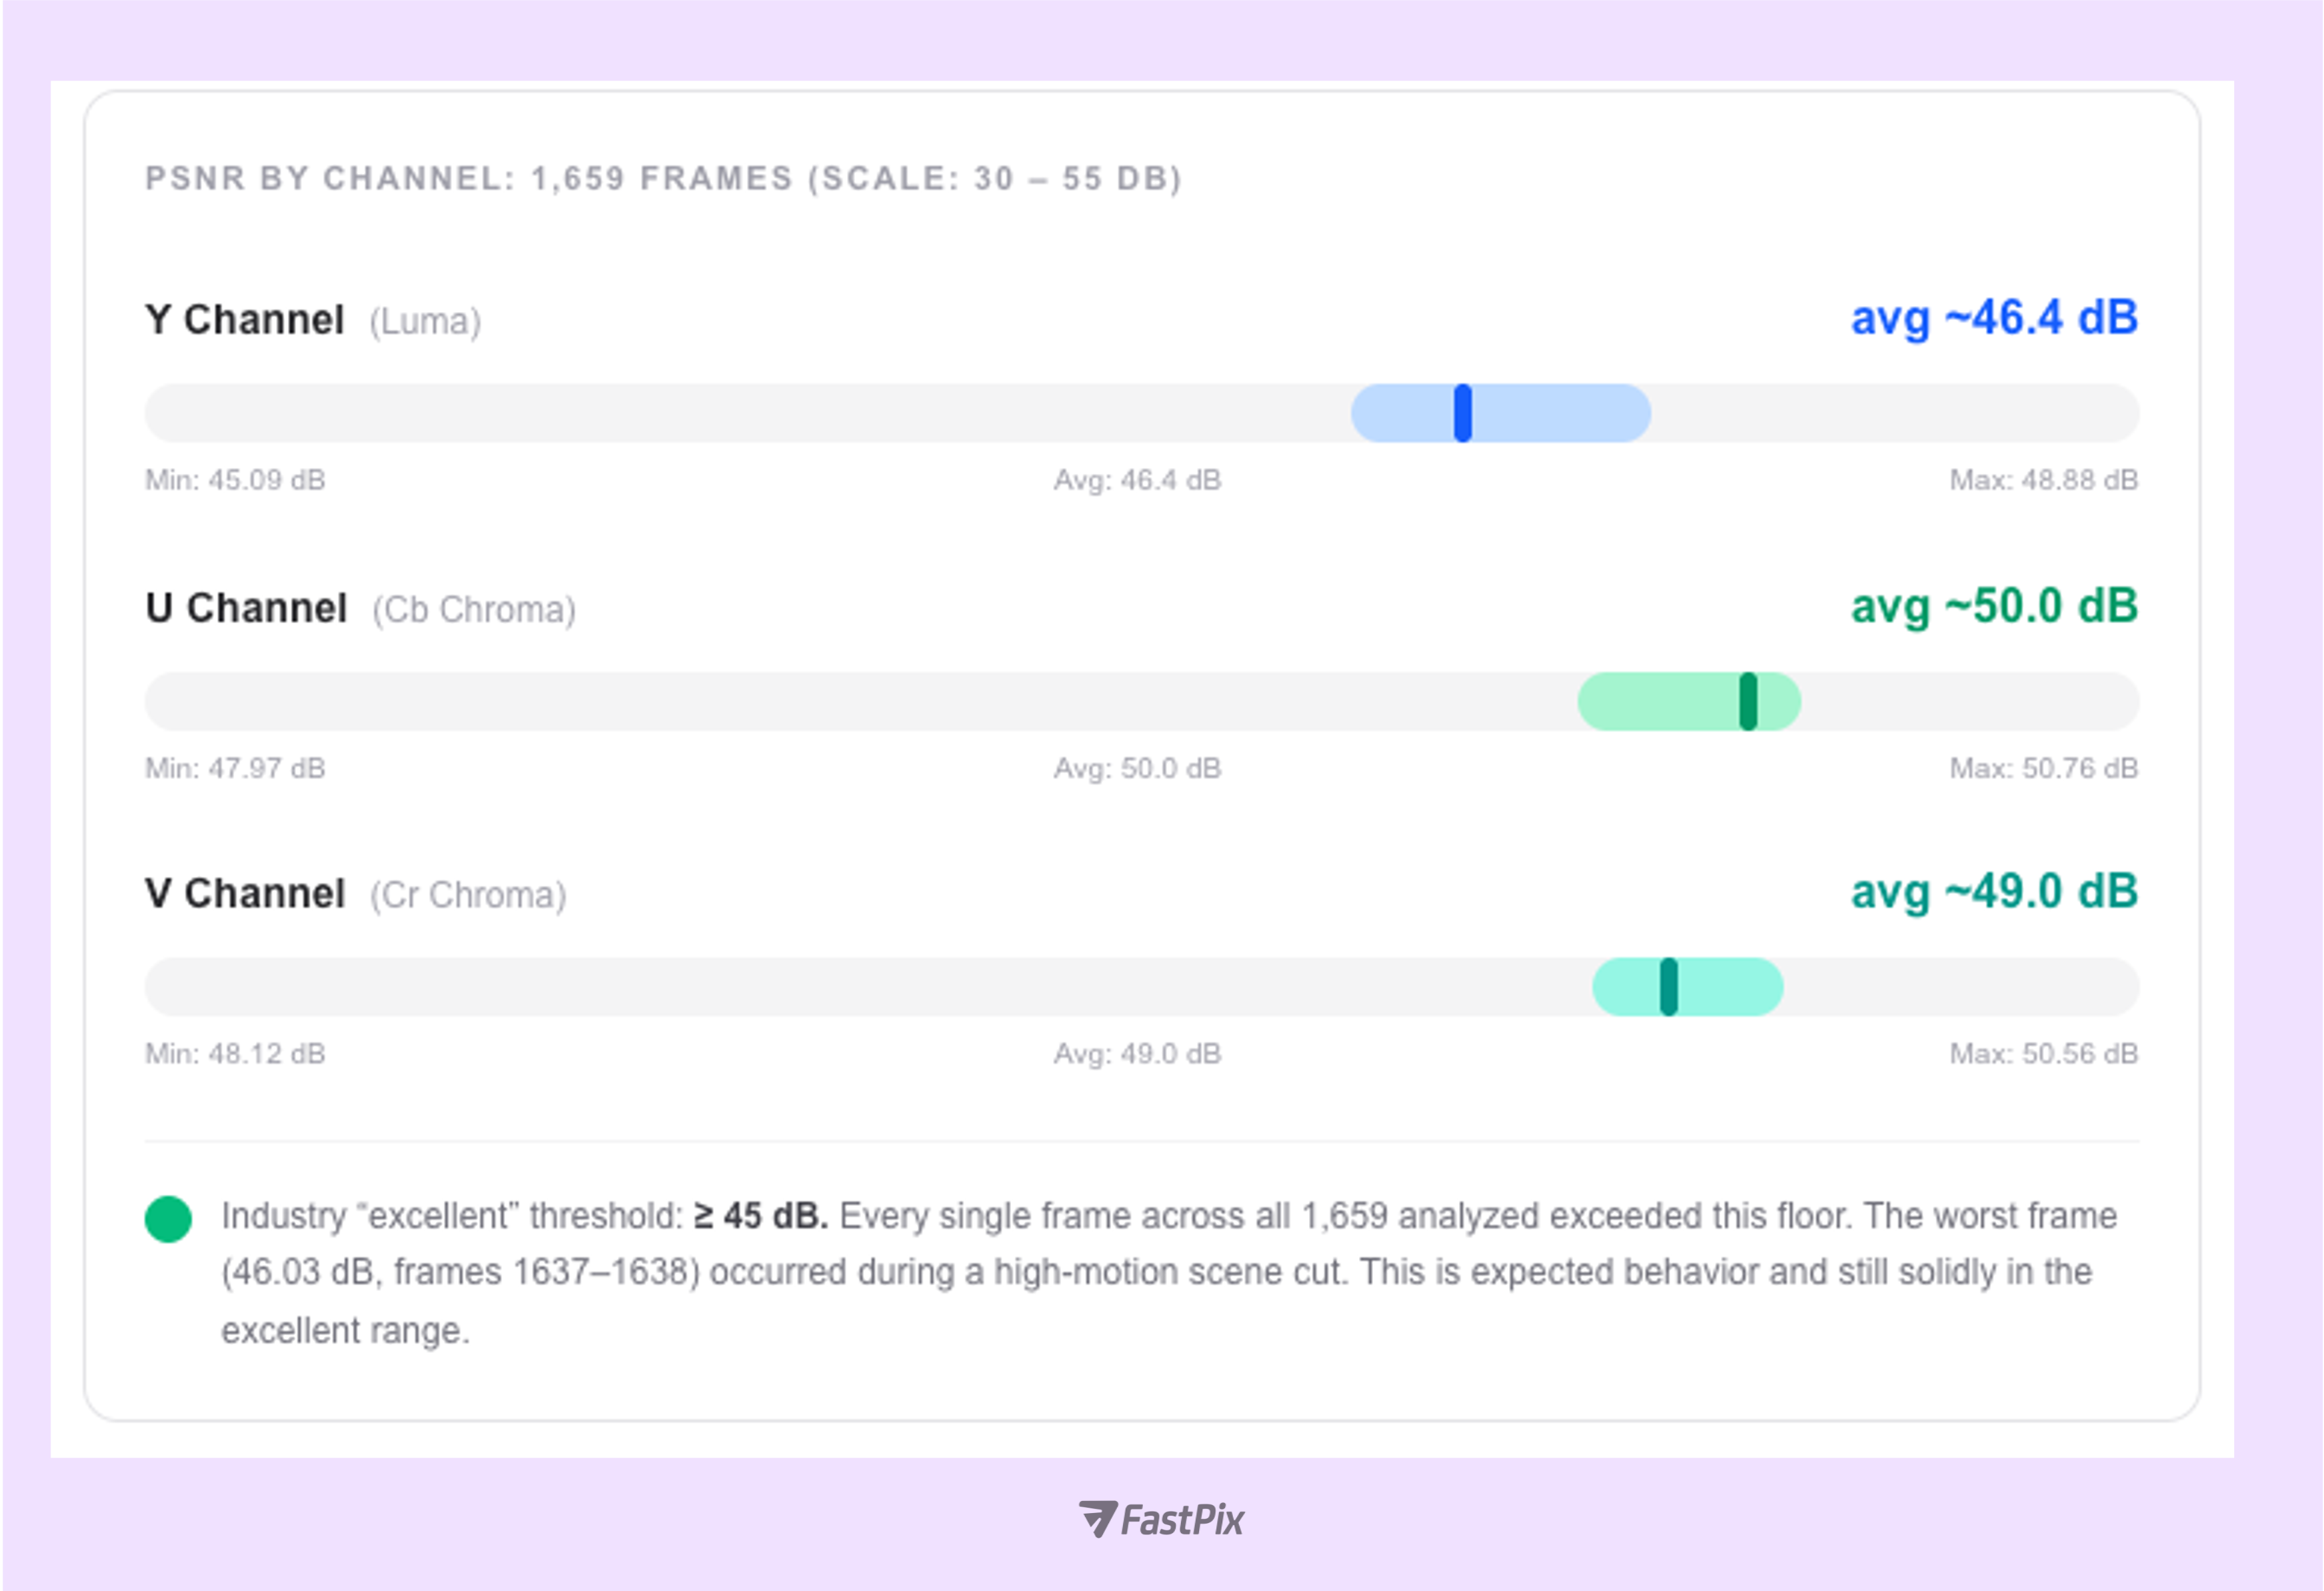
Why chroma scores higher than Luma and why that is correct
U and V channels averaged 50+ dB vs ~46.4 dB for Y. The human visual system is 3–5× more sensitive to luma errors than chroma errors. FastPix's encoder correctly allocates more bits to luma precision, so chroma scoring higher is not a weakness. It is the perceptually optimal bit allocation.
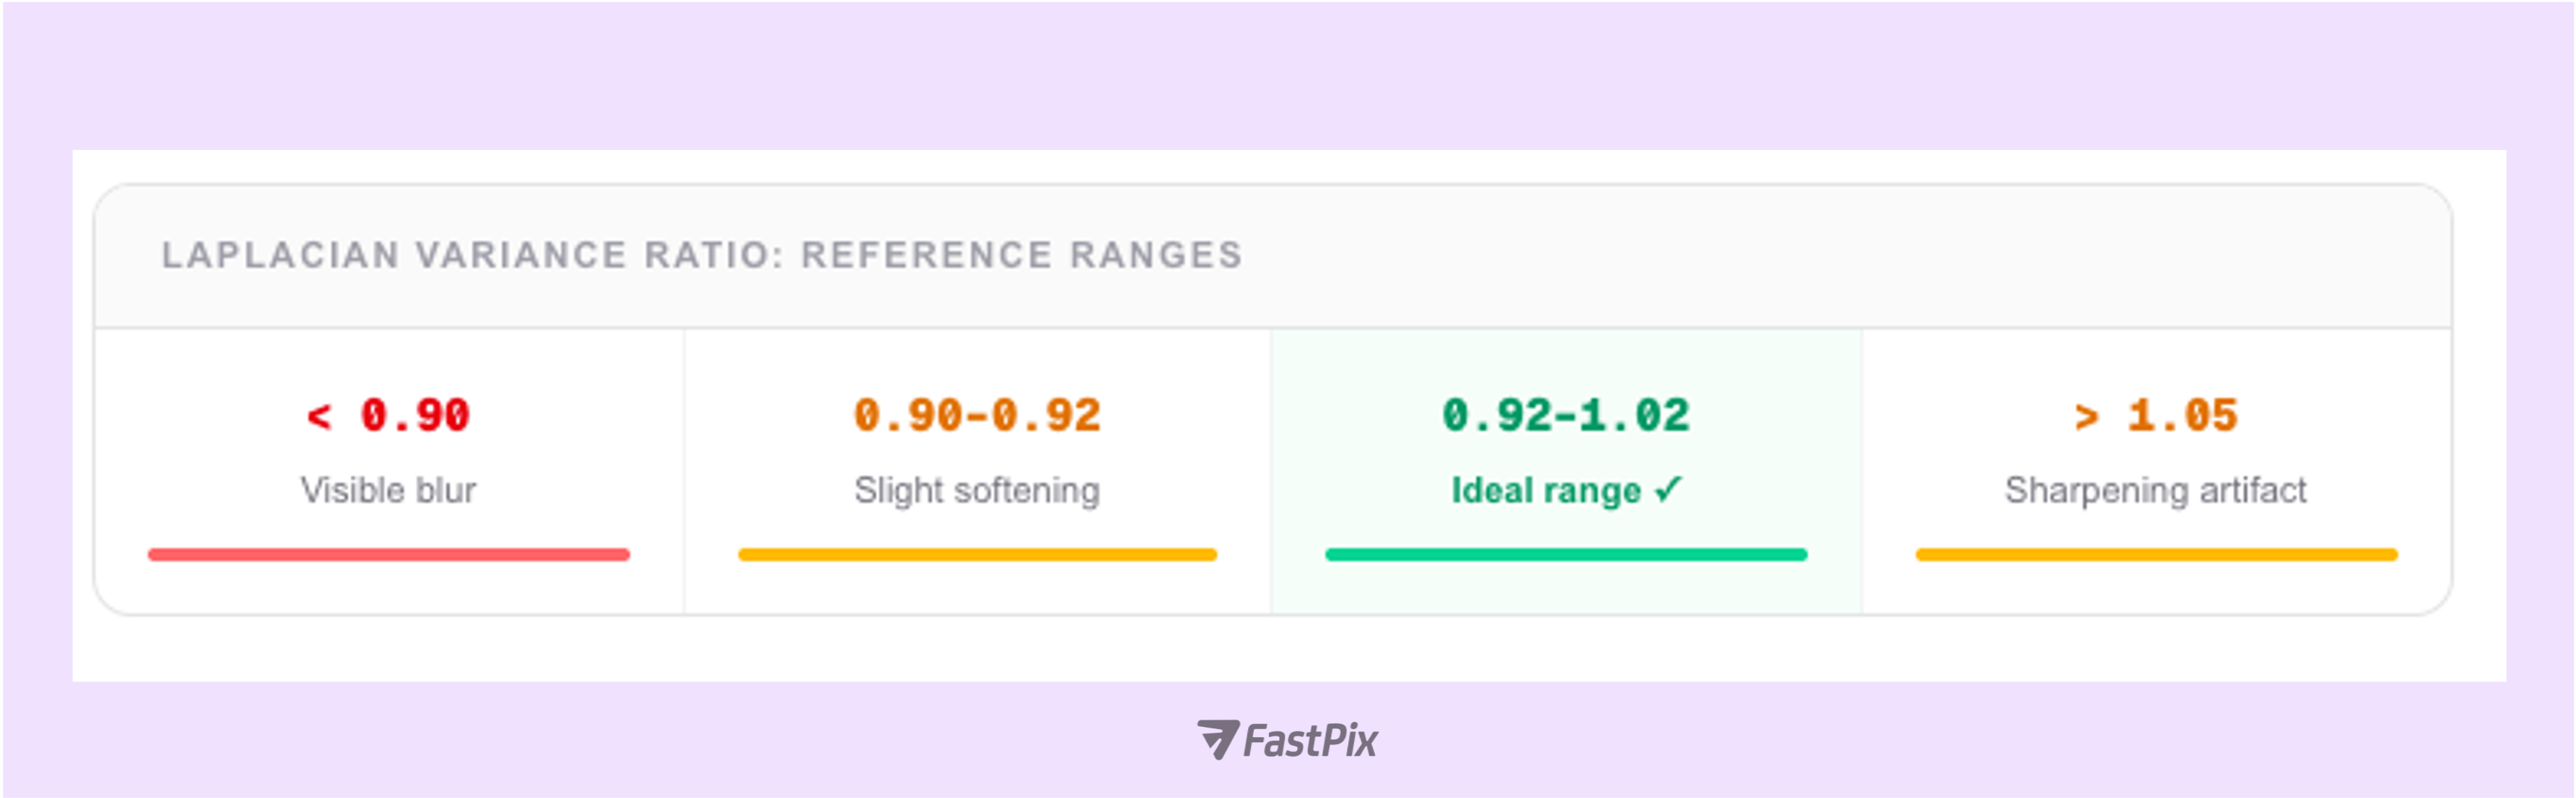
The Laplacian variance of a frame is proportional to its sharpness and edge density. Comparing this value between original and encoded frames measures how well fine structural detail including text, object boundaries, and texture survives the transcode. A ratio of 1.0 means the encoded frame is exactly as sharp as the original. Values below 0.90 indicate visible blurring; above 1.05 indicates sharpening artifacts.
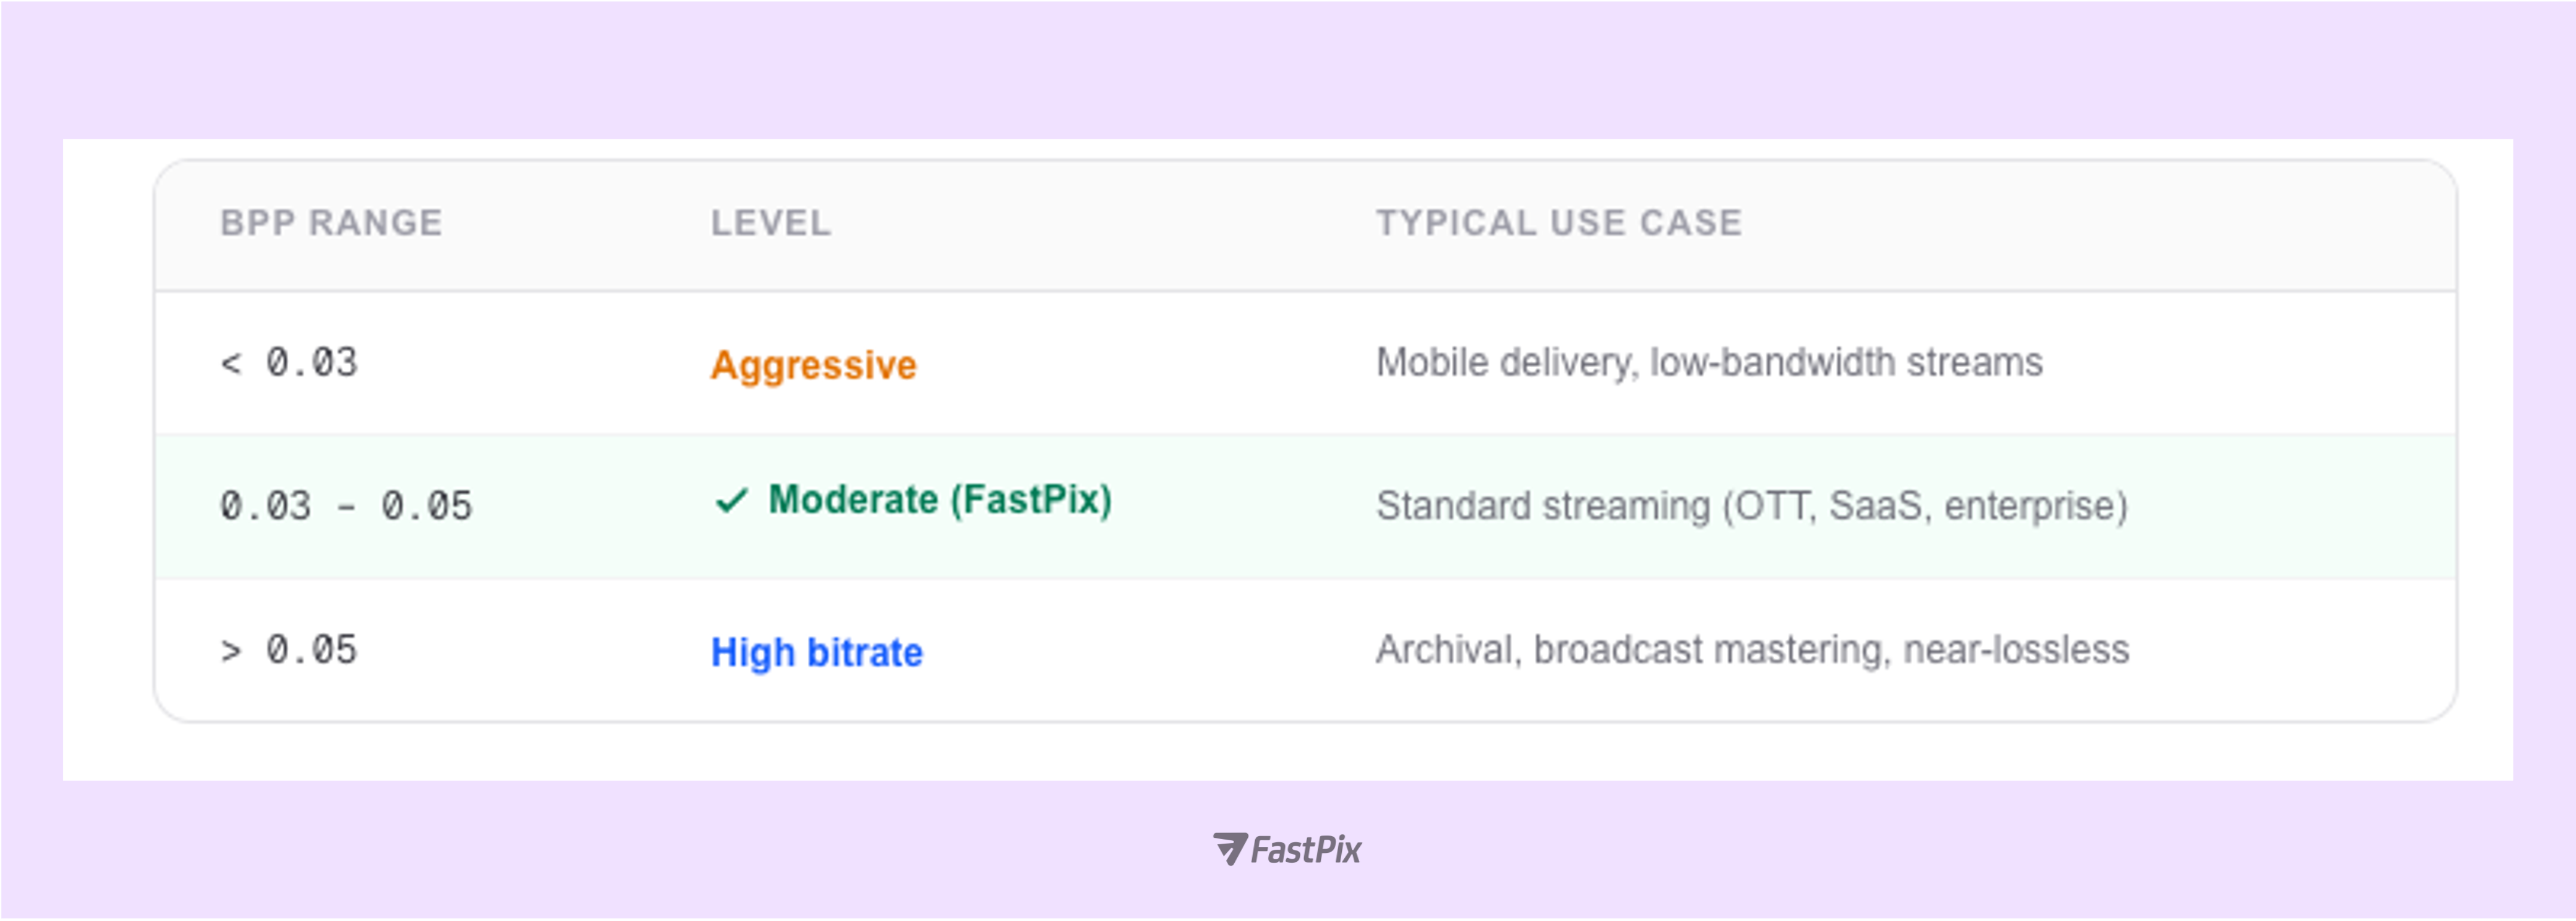
A high quality score in isolation is incomplete without knowing how efficiently that quality was achieved. The compression efficiency index, VMAF per bit, is the metric that directly maps to your CDN bill and storage spend. It measures how much perceived quality you get per bit of compressed data:
1Efficiency Index = VMAF ÷ BPP
2BPP (Bits Per Pixel) = Bitrate (bps) ÷ (Width × Height × FPS)
A higher index means more perceived quality per bit, translating directly to lower CDN bandwidth costs and lower storage spend per unit of delivered quality. With VMAF 94.97 at a typical streaming BPP (well under 0.05), FastPix achieves an “Excellent”-tier score while spending bits at the moderate compression level used for standard OTT and SaaS video delivery.
Industry trend: AV1 is raising the efficiency bar in 2026
AV1 adoption for 4K/HDR streaming is accelerating, with major platforms reporting 30–50% better VMAF-per-bit versus H.264 at equivalent bitrates. For OTT operators, this means platforms with efficient codec pipelines can deliver higher perceived quality at lower CDN cost or maintain quality while reducing bandwidth budgets by up to 40%. Compression efficiency (VMAF/BPP) is the metric to watch as your infrastructure scales.
Compression artifacts are the visible side effects of lossy encoding. This test ran frame-by-frame analysis across all 1,660 frame pairs to detect and measure four distinct artifact types. Each was computed per-frame and averaged across the full video.
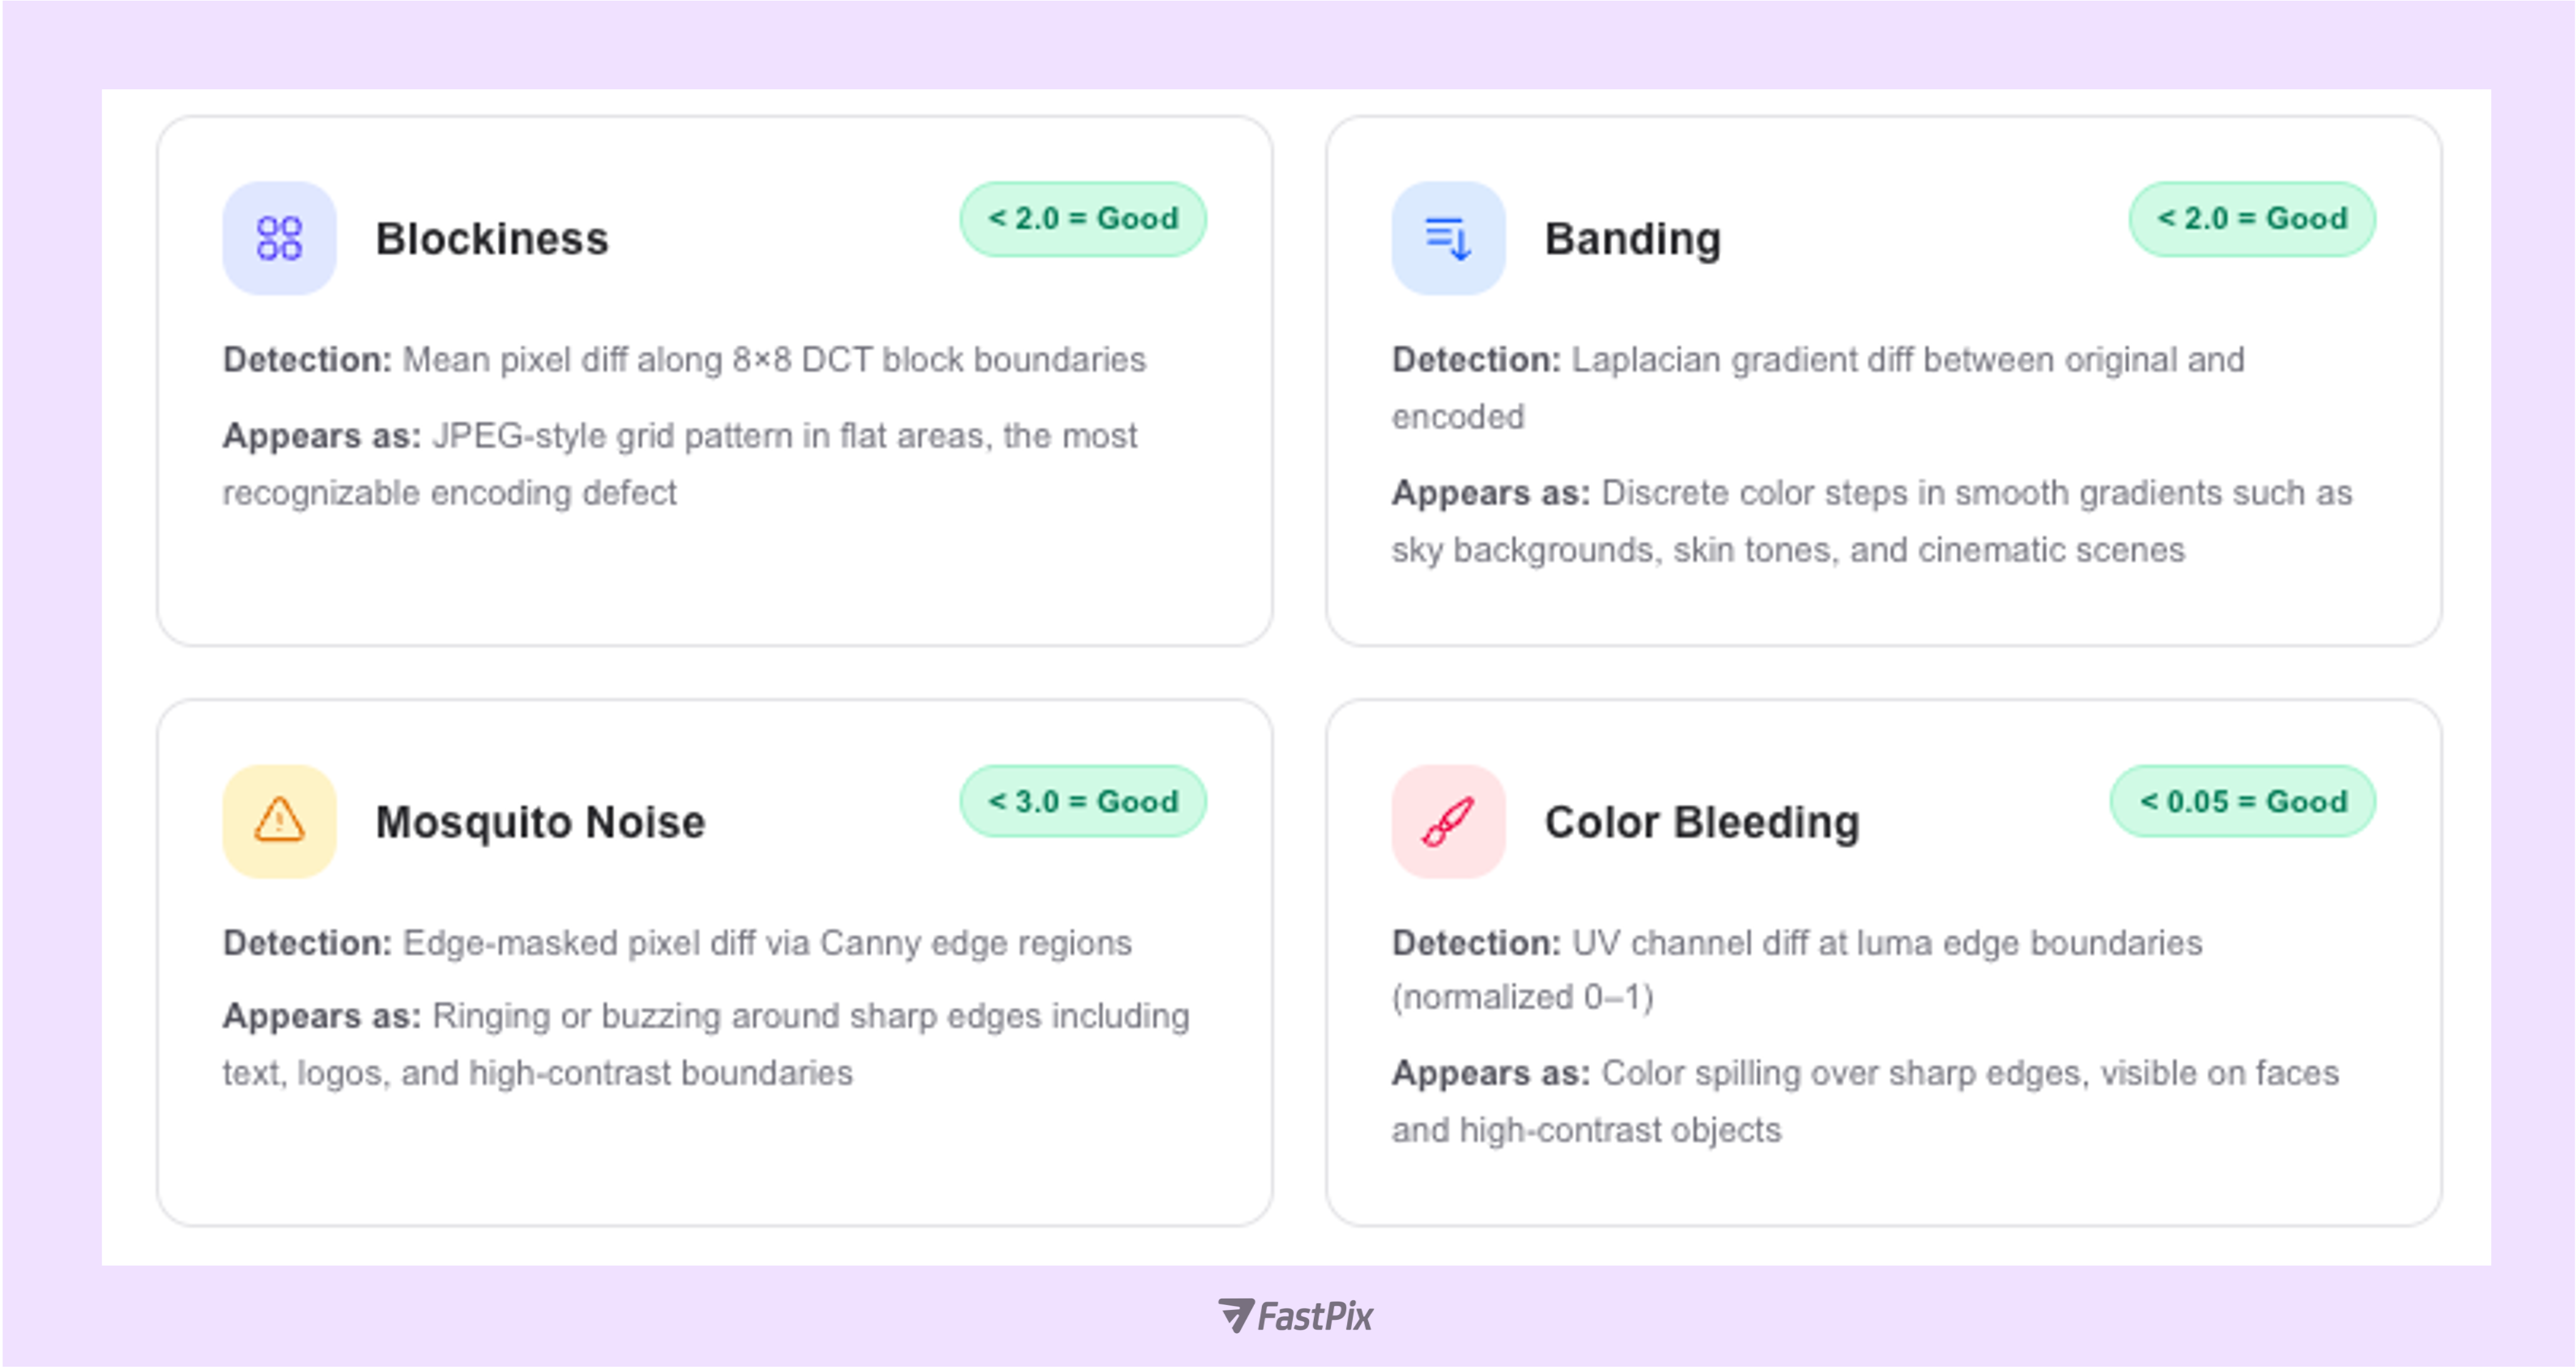
All four artifact types: within “Good” thresholds
The VMAF 94.97 and SSIM 0.991 scores are directly consistent with all four artifact metrics falling in their Good ranges. FastPix's deblocking and in-loop filtering pipeline effectively suppresses blockiness and mosquito noise without sacrificing edge sharpness.
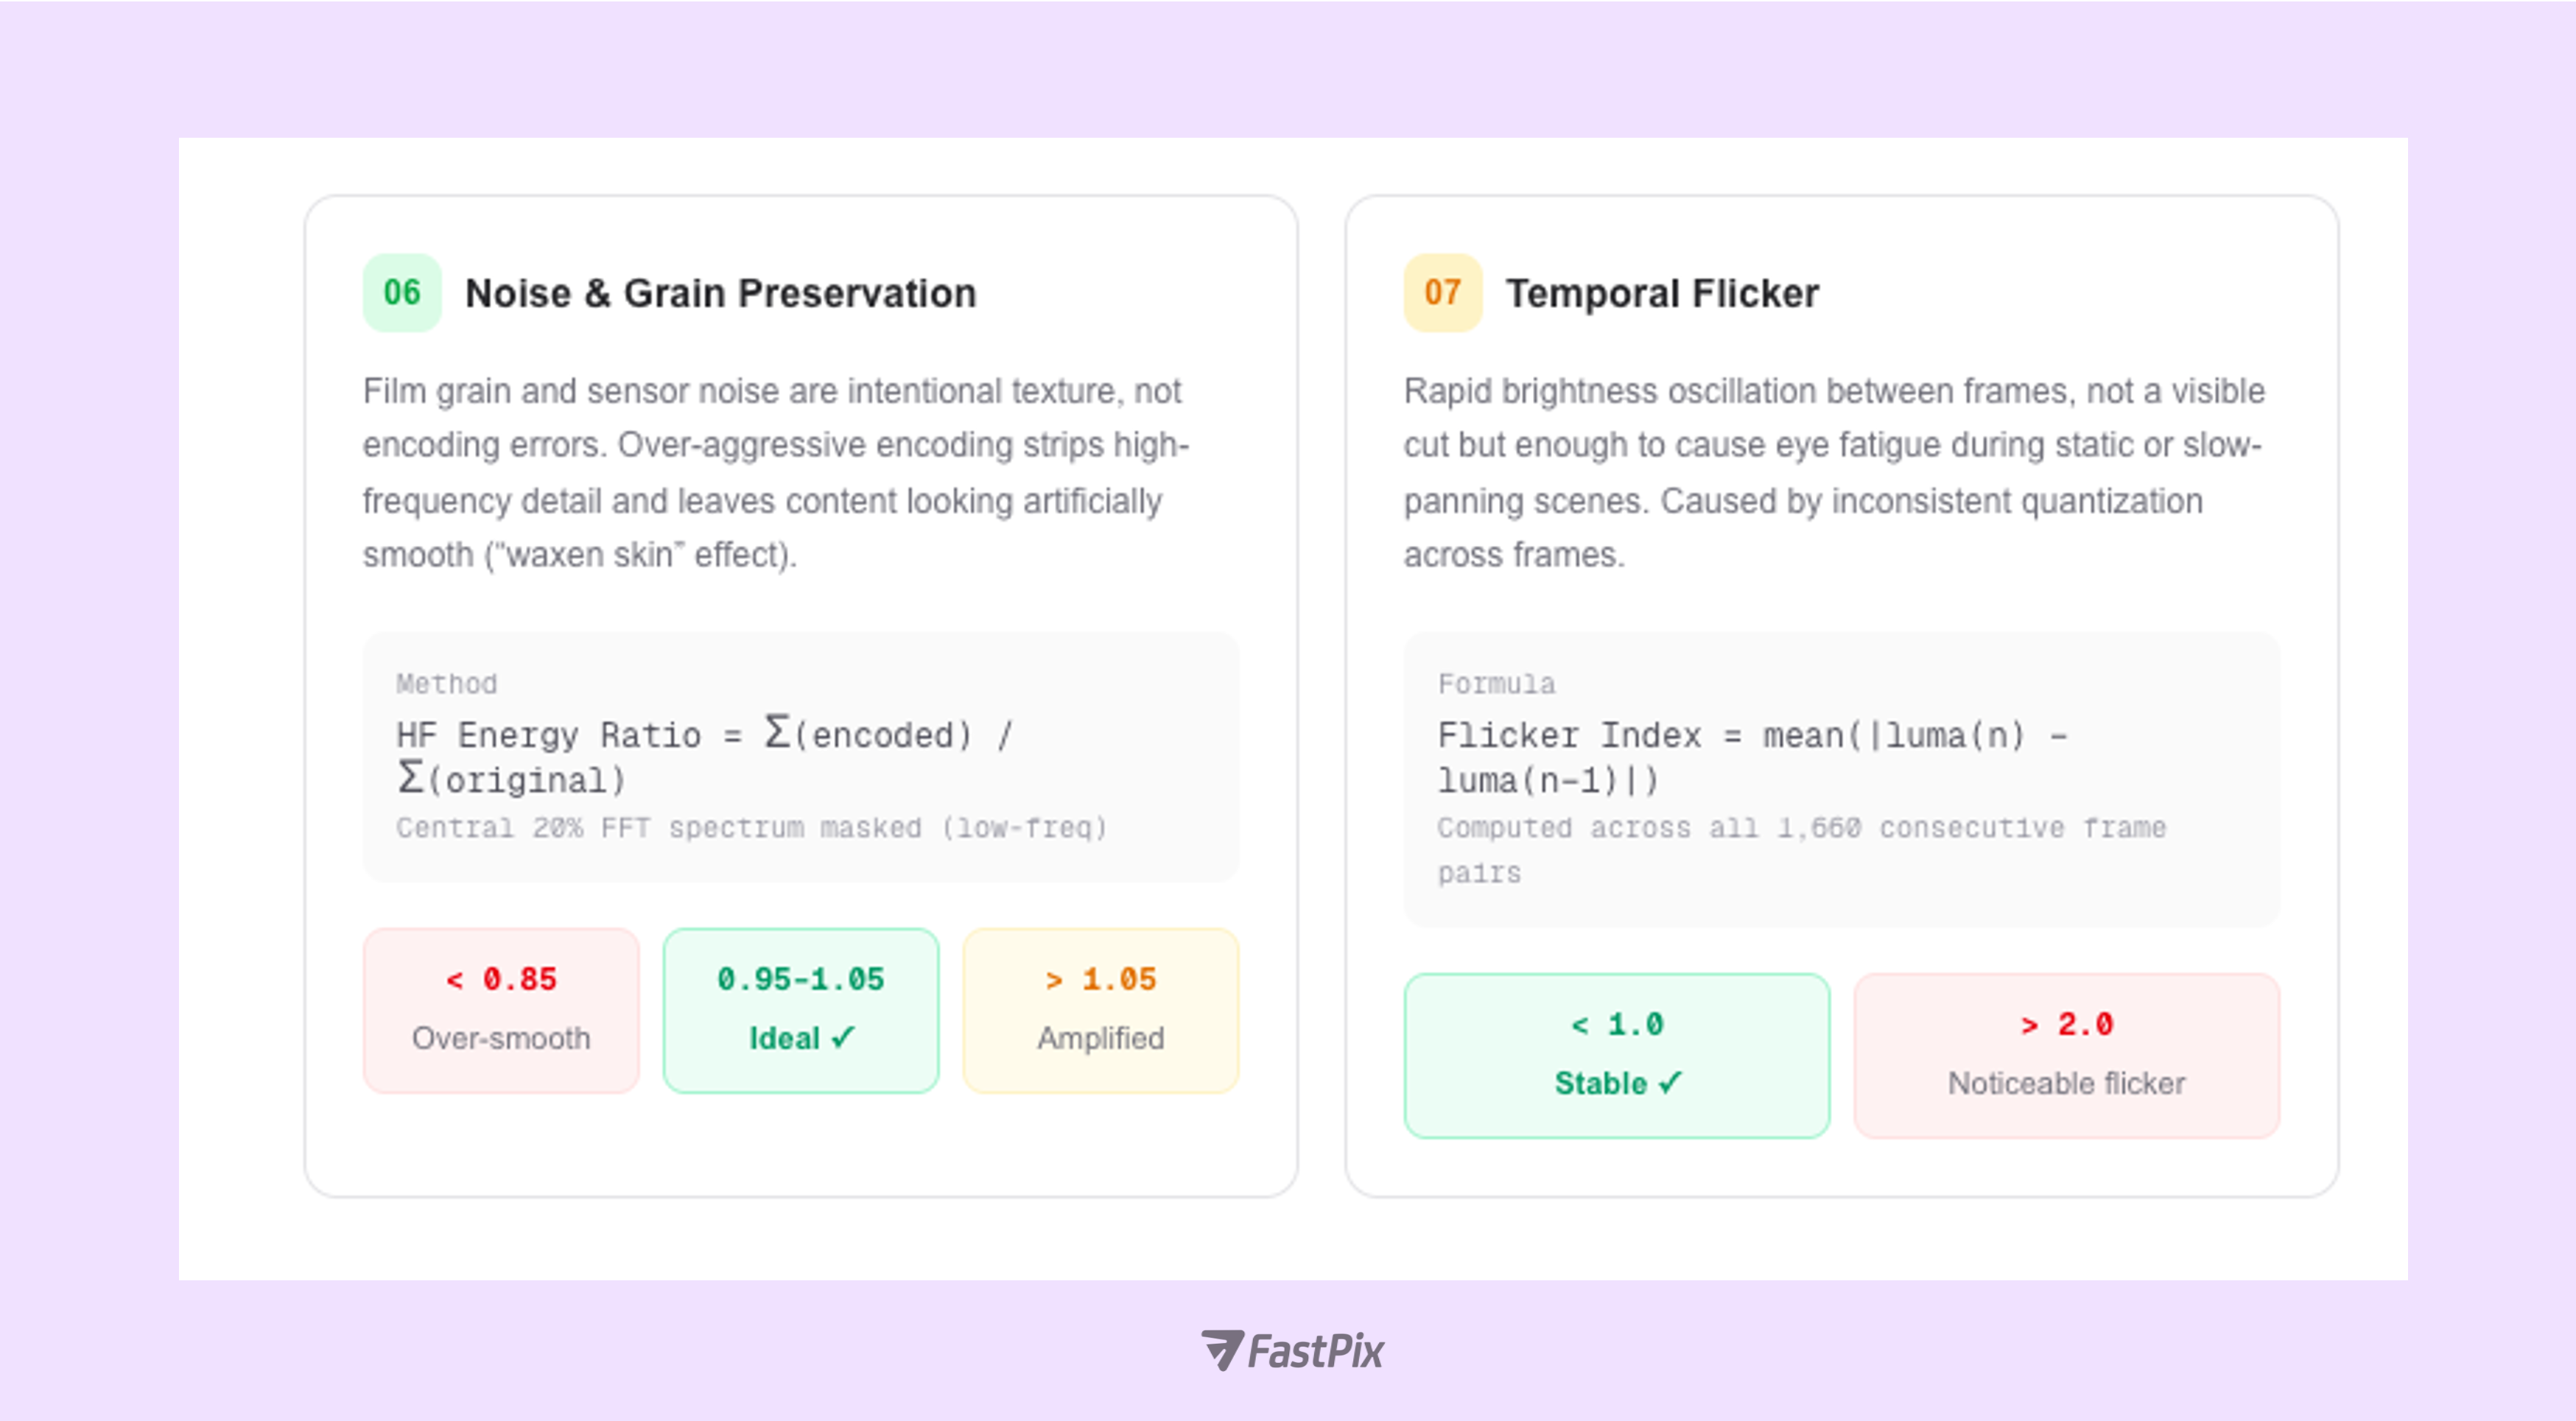
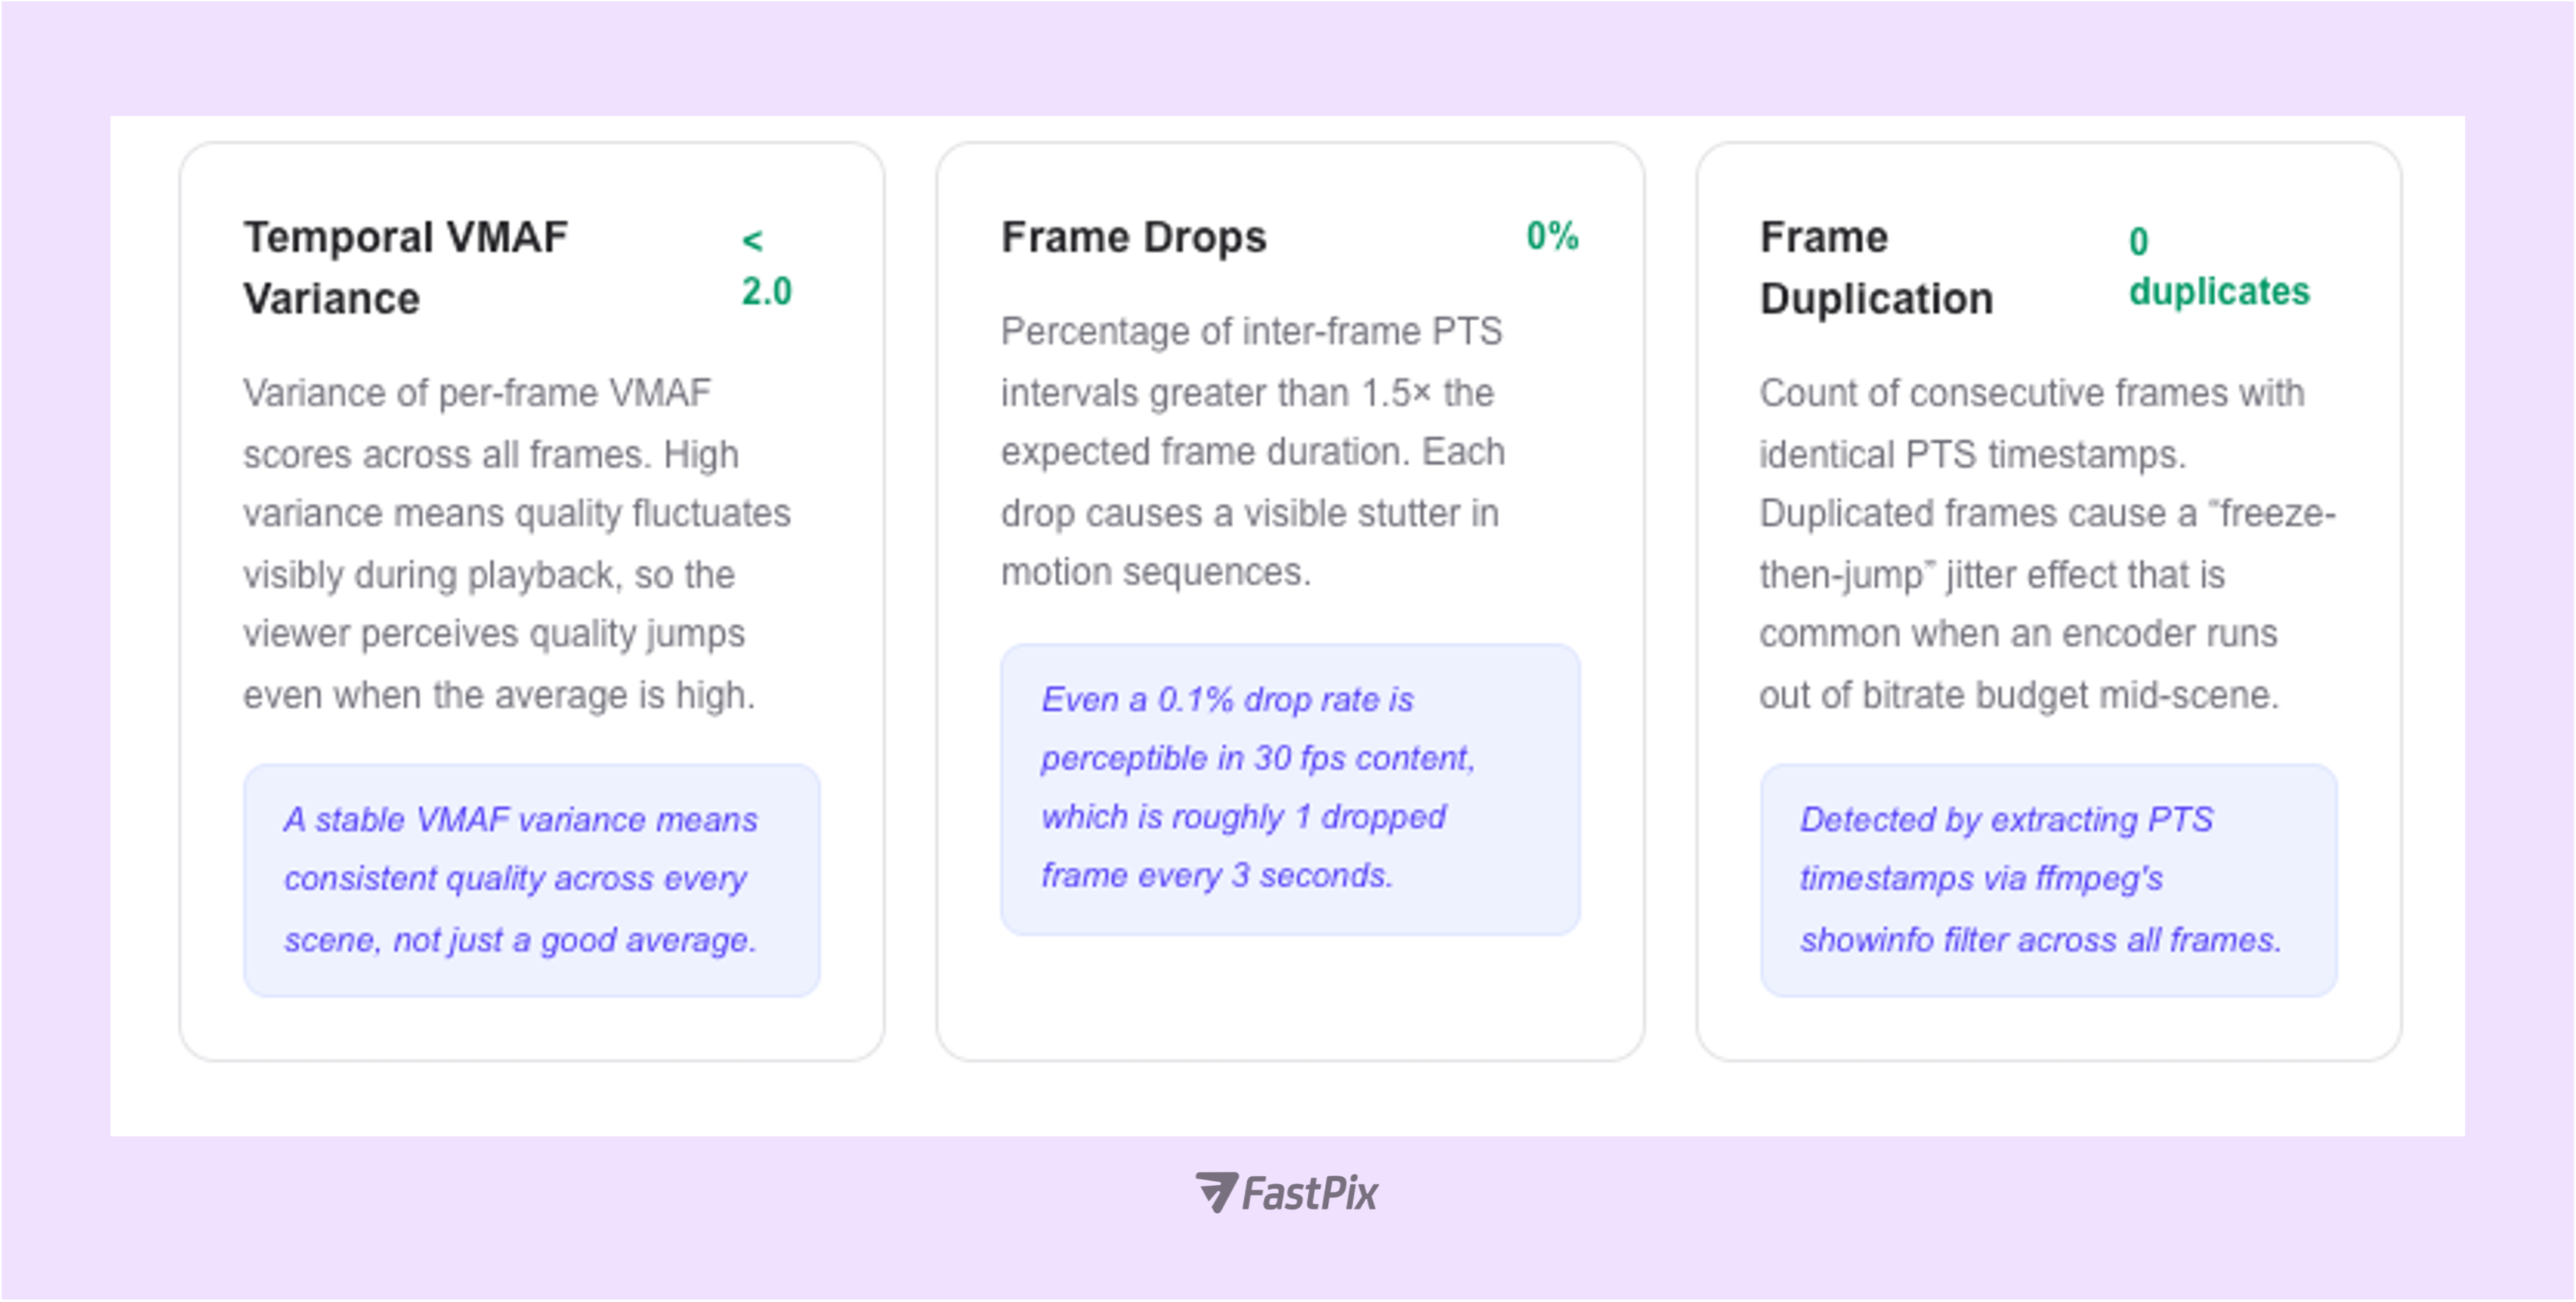
Motion quality testing examines whether the encoded video faithfully represents motion from the source, without dropped frames, duplicated frames, or per-frame quality instability that causes visible quality fluctuation during playback.
A/V sync drift above 80 ms is detectable by most adults; above 125 ms it becomes distracting; above 185 ms it resembles a poorly dubbed film. For live events, product demos, and interview-style content, A/V sync is the single most noticeable quality issue. Viewers complain about it immediately and often don't return. We use a spike-alignment approach, detecting simultaneous audio and video transients and measuring the temporal offset between them in milliseconds.
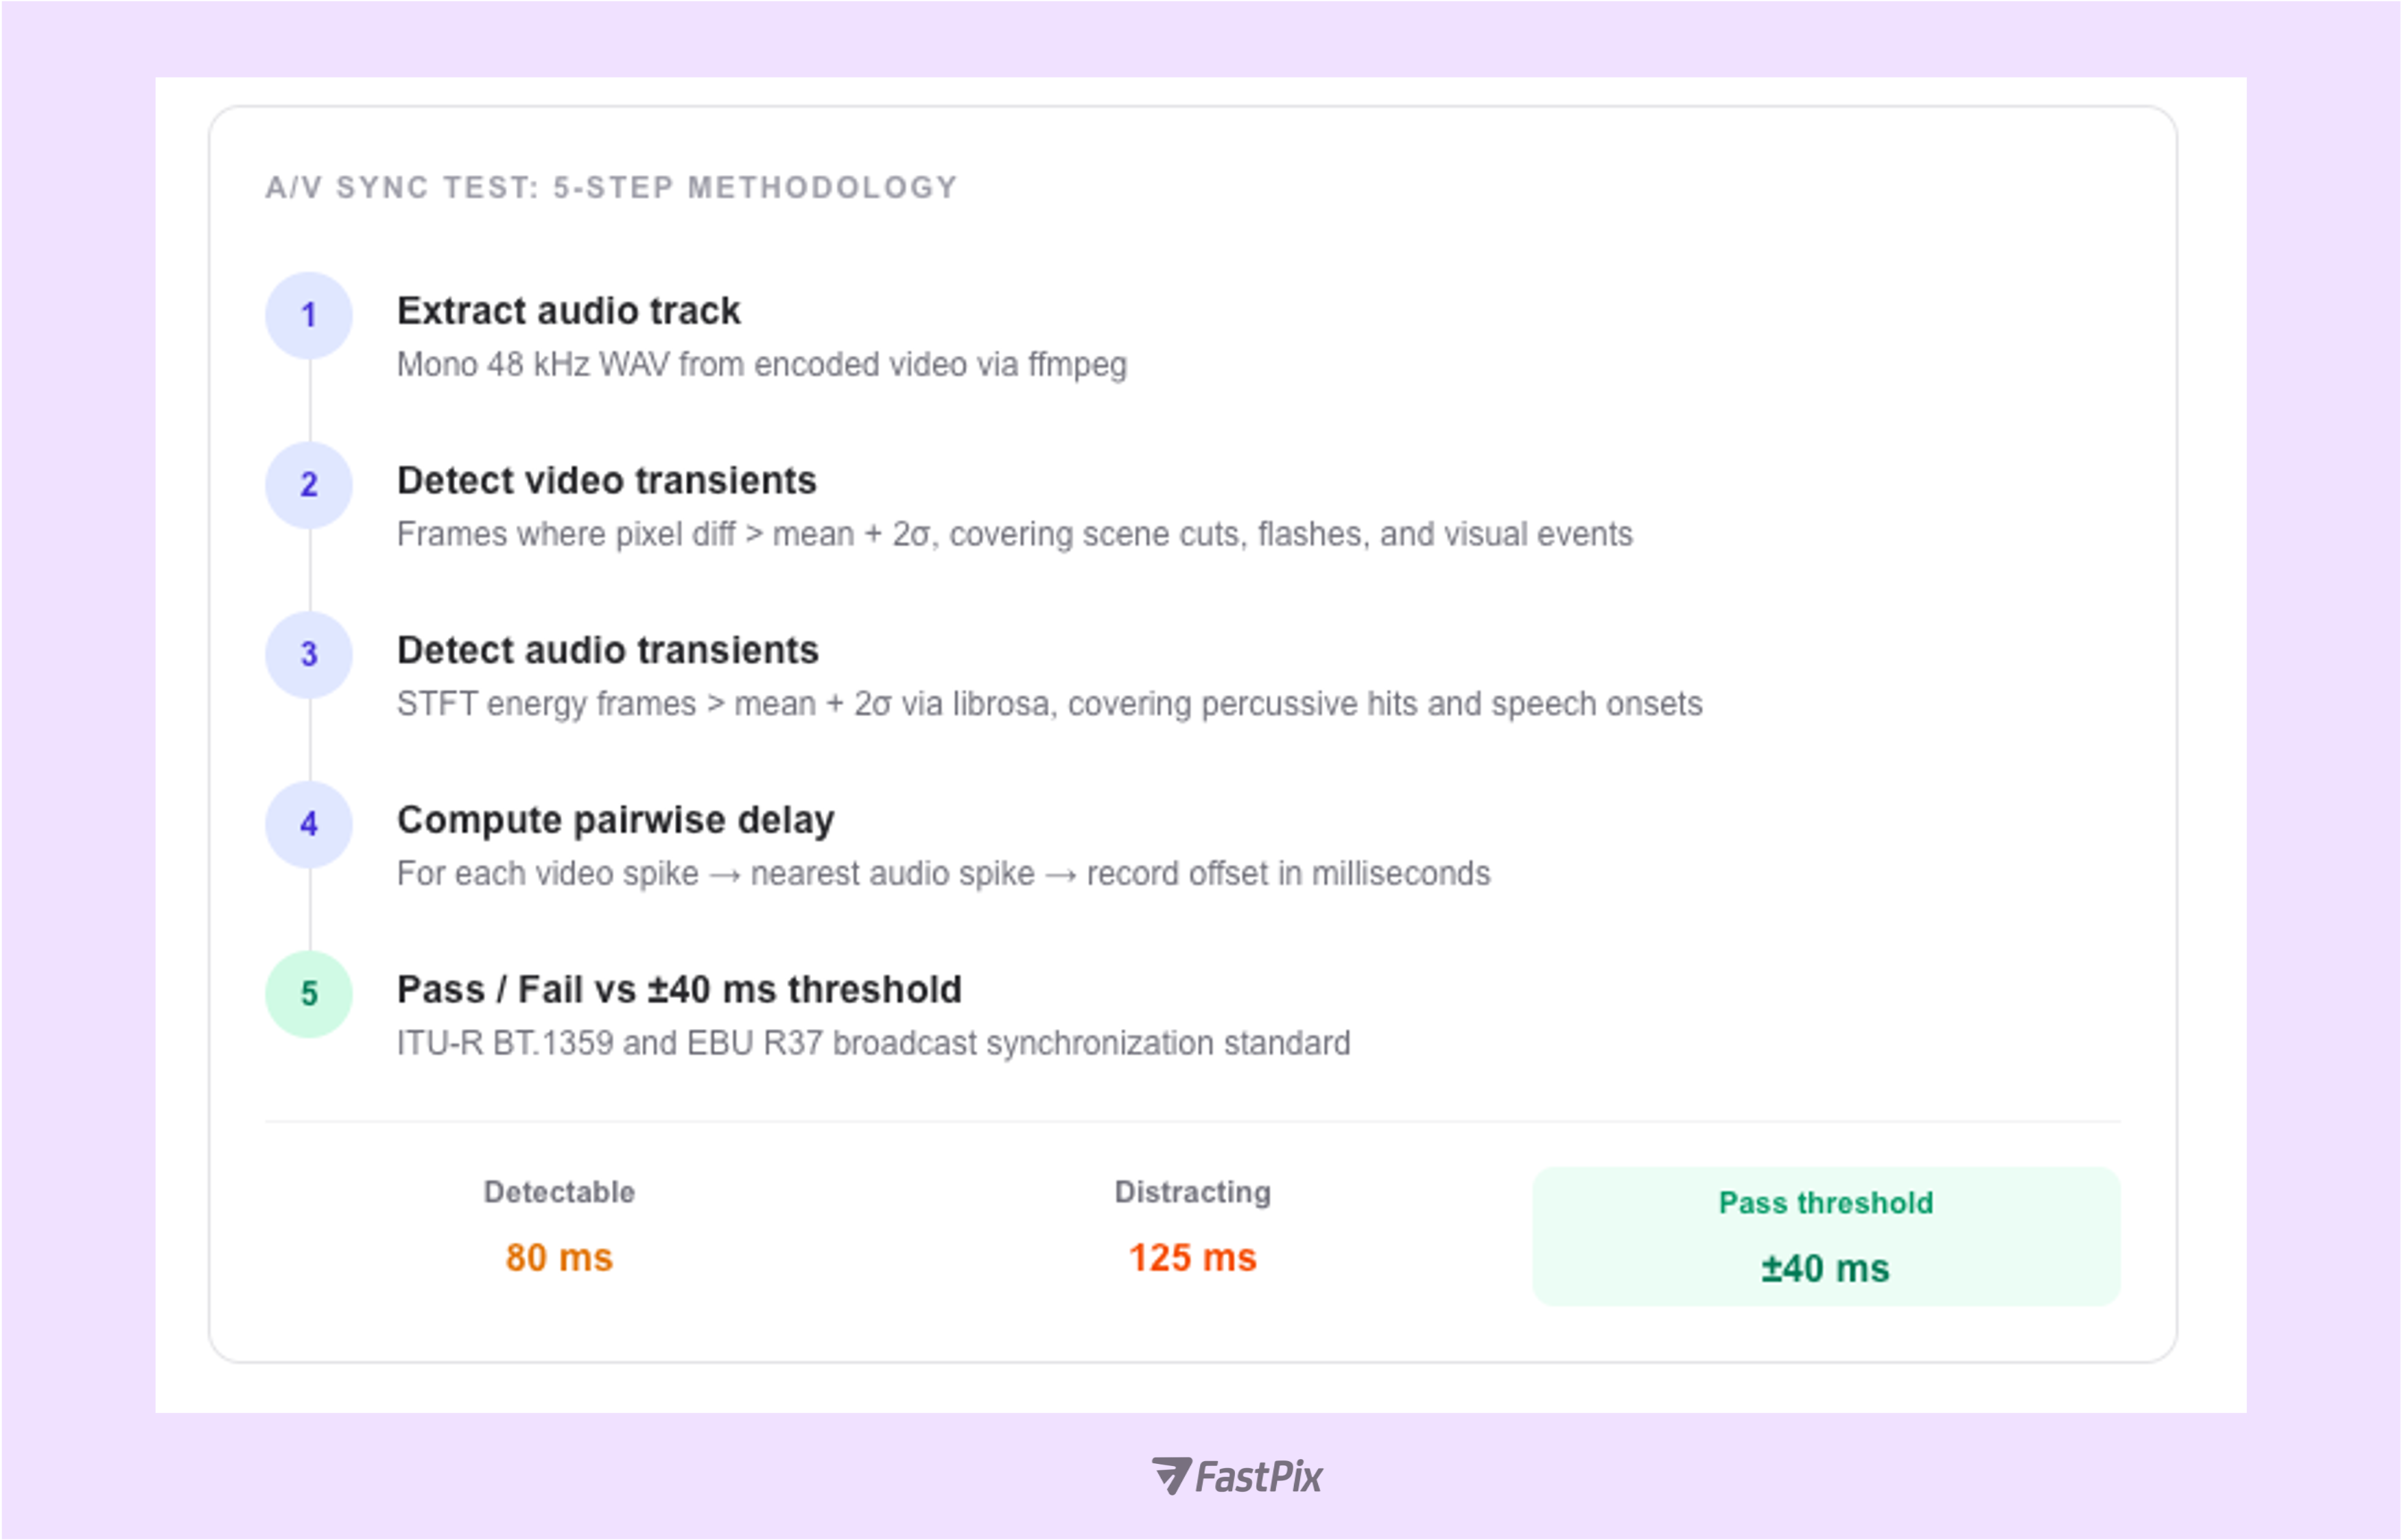
OTT impact: A/V sync is a direct churn trigger
In interview content, webinars, and live events, A/V desync above 80 ms generates immediate viewer complaints. Above 185 ms it feels like a dubbed foreign film and viewers leave. FastPix's pipeline passing the ±40 ms ITU-R BT.1359 broadcast standard means your presenters' lips always match their words, your SFX land on-beat, and your brand never suffers from a “broken video” reputation.
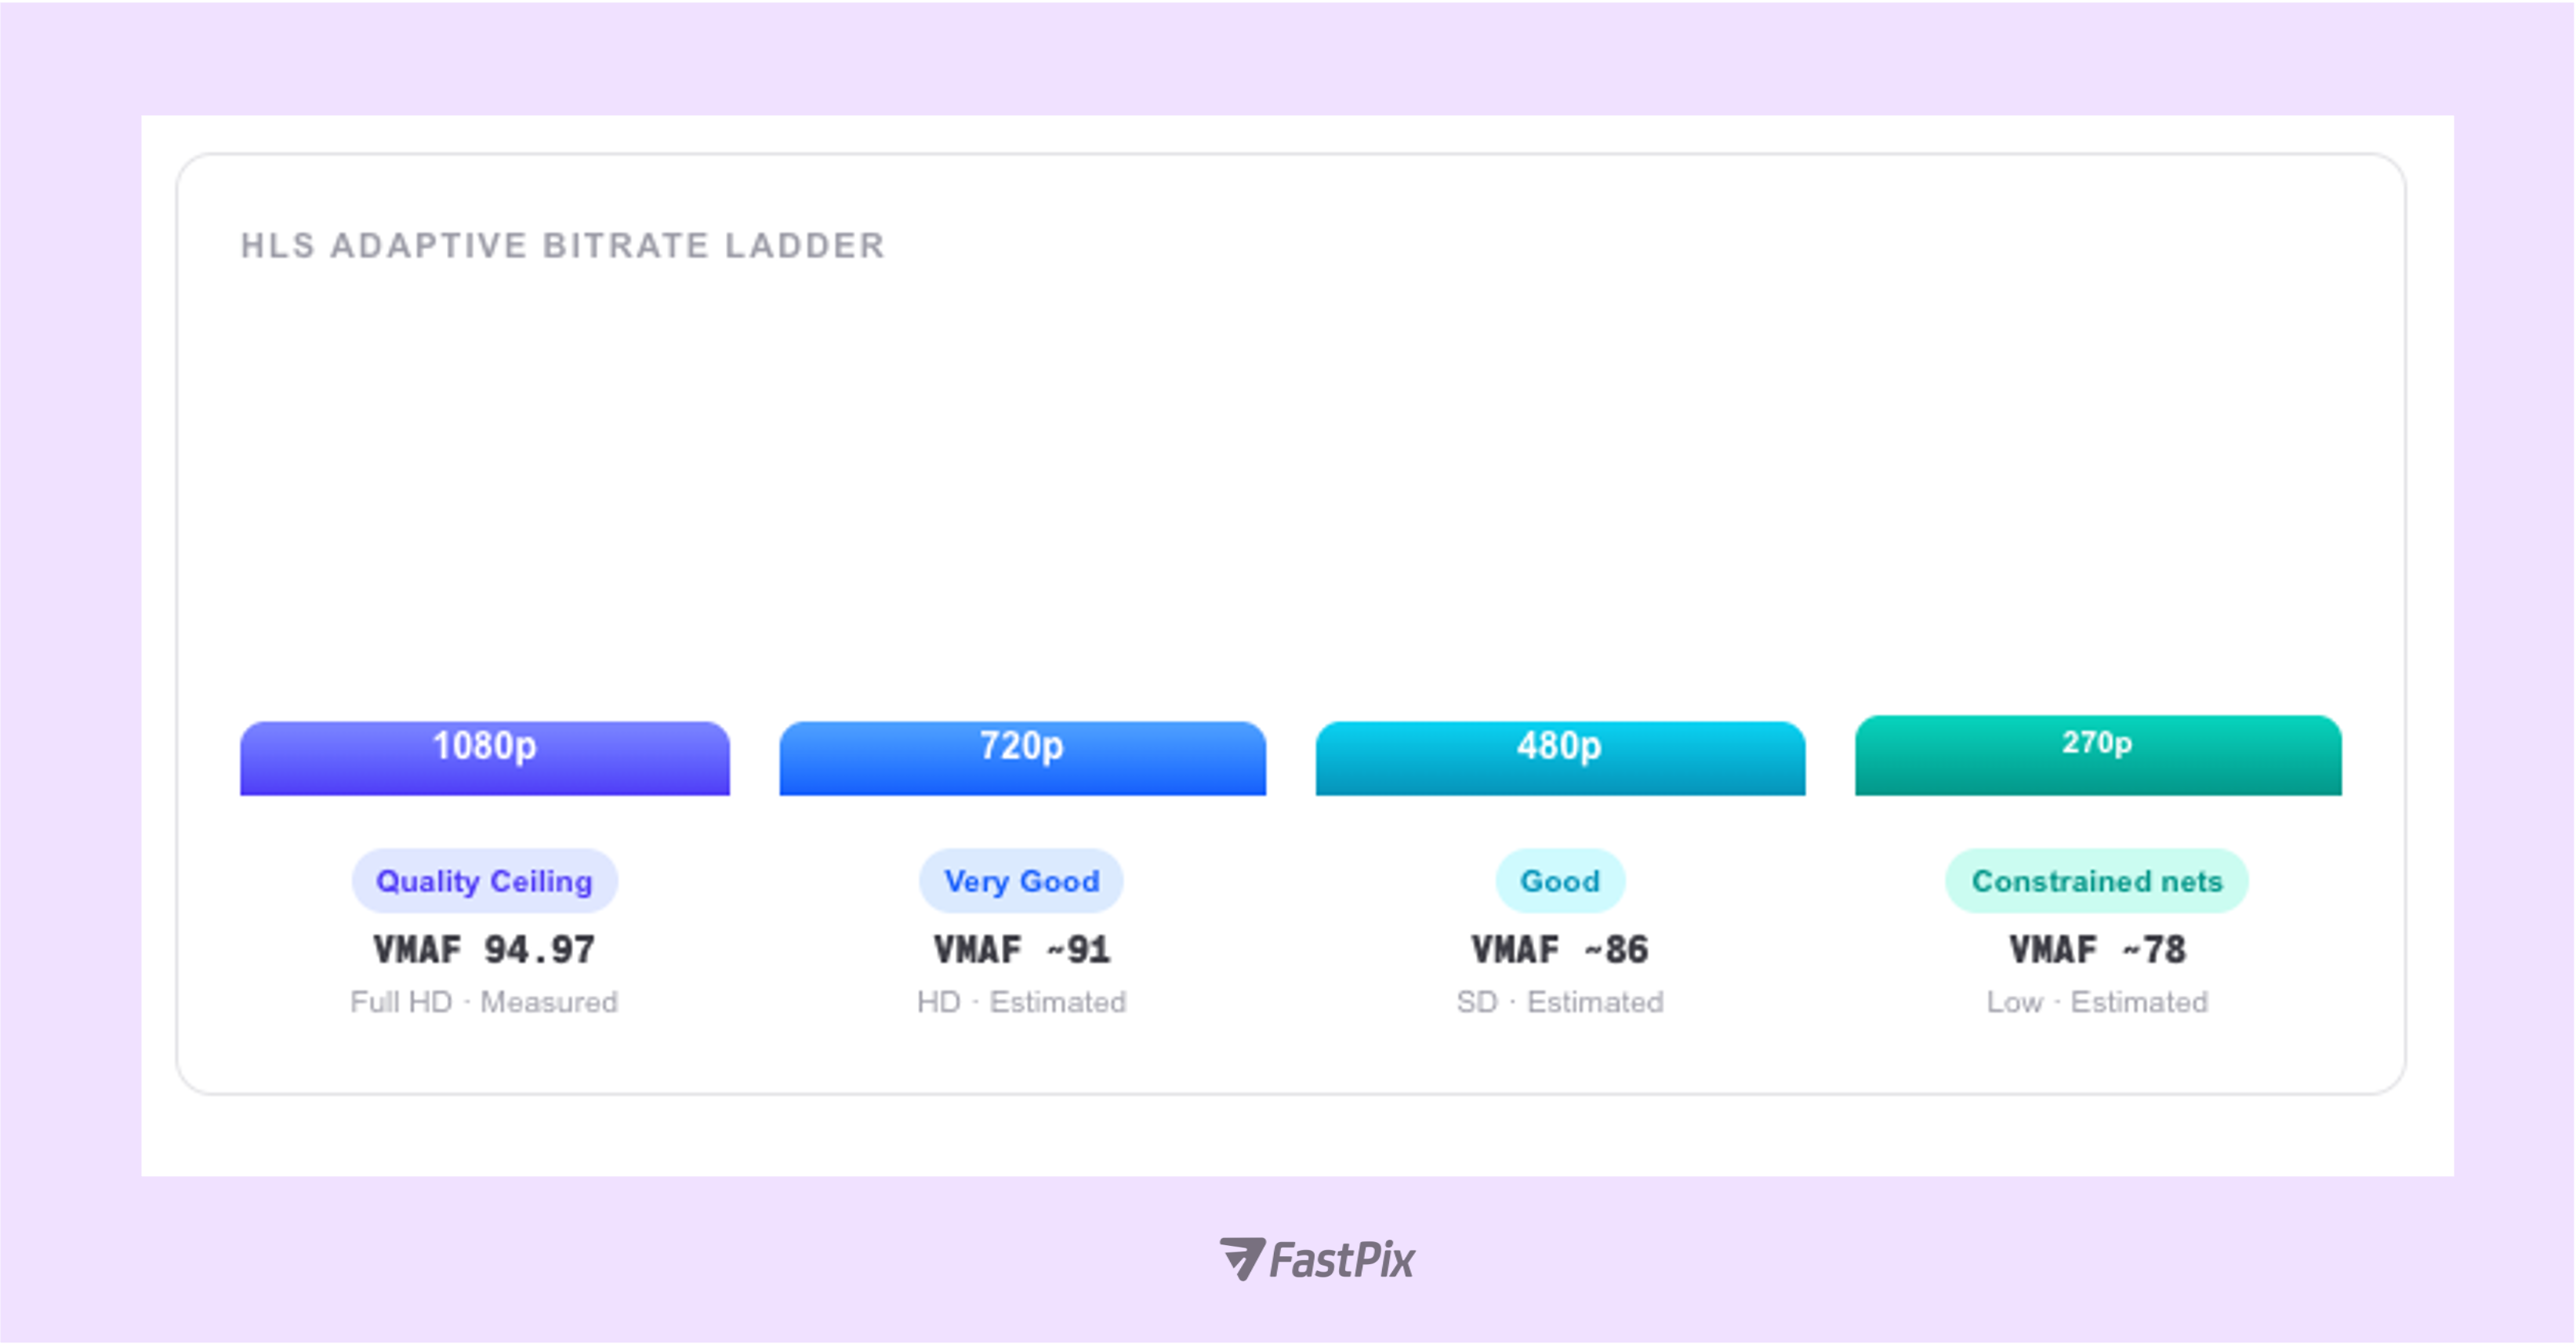
FastPix generates four HLS renditions from a single source upload. The adaptive bitrate player selects the appropriate rendition at runtime based on measured network throughput. With VMAF 94.97 at the 1080p ceiling, the ABR algorithm has maximum quality headroom, so even at 720p the encoded quality remains in the “Very Good” range.

1. VMAF 94.97: Broadcast-Grade Quality
Premium OTT targets VMAF ≥ 93. FastPix achieved 94.97, placing it firmly in broadcast territory. At this level, viewers cannot distinguish the encoded output from the source under normal conditions.
2. PSNR Floor 46.03 dB: No Motion Collapse
Across 1,659 frames, the lowest PSNR recorded was 46.03 dB, even during high-motion transitions. This confirms stable bit allocation and no quality breakdown under stress.
3. Perceptually Optimal Bit Allocation
Higher precision on chroma (50+ dB) and controlled luma (~46.4 dB) reflect correct rate–distortion tuning aligned with human visual sensitivity.
4. Heatmaps Show Intelligent Compression
Quality differences are limited to motion boundaries (where the eye is tolerant). Static regions remain near-perfect. No widespread degradation detected.
5. 9/9 Quality Tests Passed
Across VMAF, SSIM, PSNR, edge retention, compression efficiency, artifacts, noise, temporal stability, and A/V sync, no perceptible defects were identified.
The full test suite uses open-source tools.
Environment requirements:
ffmpegcompiled with libvmafRuntime expectations:
To benchmark another provider, replace the encoded file path and re-run the scripts.
The methodology remains identical. Only the encoded file changes. This ensures a clean, apples-to-apples comparison across pipelines.
We’ve published the complete test framework, including scripts, environment setup instructions, and reporting utilities, in a public GitHub repository so you can reproduce or extend the analysis independently.
Repository: https://github.com/FastPix/video-quality-benchmark-tool
Clone it, follow the setup instructions, and run the same suite against any encoded output you want to evaluate.
A VMAF score above 93 is generally considered excellent and is often treated as a broadcast-quality benchmark. At 94.97, the encoded output is perceptually indistinguishable from the source for the vast majority of viewers under normal viewing conditions. In practical OTT terms, this means viewers will not notice compression artifacts during motion-heavy scenes, cinematic gradients, or detailed textures. The video feels clean, stable, and consistent. For platforms, that translates directly into better viewer retention and fewer quality-related complaints.
Each metric evaluates a different dimension of quality. VMAF models human perception using machine learning trained on subjective viewing data. SSIM evaluates structural similarity between frames, focusing on luminance, contrast, and texture preservation. PSNR measures signal-level error in decibels and provides a mathematical lower bound on distortion. Using all three ensures the encoder is not only mathematically accurate but also perceptually faithful. A single metric can mask weaknesses. Multi-metric validation provides confidence across perceptual, structural, and signal domains.
The 1080p rendition represents the highest-resolution encoded output and effectively acts as the quality ceiling of the adaptive bitrate ladder. If the ceiling holds broadcast-grade fidelity, lower renditions derived through controlled downscaling typically follow predictable perceptual behavior relative to bitrate allocation. That said, the methodology is fully reproducible. If required, each rendition can be independently tested using the same scripts to validate performance at every tier of the ladder.
No. This benchmark focuses strictly on encoder output quality. It does not evaluate CDN routing behavior, adaptive bitrate switching logic, startup latency, rebuffering, or packet loss resilience. Those are delivery-layer concerns and require separate testing under controlled network throttling scenarios. This analysis answers a different question: when the encoded file leaves the pipeline, how faithful is it to the source?
Publicly reported VMAF benchmarks across platforms typically cluster between the low 90s and mid 90s for 1080p OTT workflows, depending on bitrate and codec selection. A score of 94.97 places the output firmly in the upper broadcast tier. What ultimately matters is not marketing claims but reproducibility. Because the full test suite and scripts are available, anyone can run the same methodology against another provider and generate an objective comparison using identical criteria.
Yes. The methodology is provider-agnostic. Replace the encoded output file, re-run the scripts, and compare the resulting VMAF, SSIM, PSNR, artifact metrics, and heatmaps. The process remains identical, which ensures clean, apples-to-apples comparisons across encoding pipelines.


.avif)

.png)